

Ethereum Price Prediction: ETH/USD Stuck in Range; Price Fails to Cross $1900 Resistance

ETH Price Prediction – March 16
According to the daily chart, the Ethereum price is trading in a broad range against the US Dollar, while Bitcoin is struggling.
ETH/USD Market
Key Levels:
Resistance levels: $2100, $2200, $2300
Support levels: $1500, $1400, $1300
Looking at the daily chart, it was discovered that ETH/USD is yet to cross above $1900 resistance, the coin declines below $1800 but the price is currently correcting higher, it is likely to face the resistance near $1800 and $2000. As the daily chart reveals, there is a connecting bearish trend line forming with resistance near $1796 on the daily chart of ETH/USD.
What is the Next Direction for Ethereum?
Ethereum (ETH) is at an astounding level. The coin took a leap from the current price and started dealing at $1850. A few days ago, the coin began an upward movement since March 1 where it moved from $1421 and continued until March 13 that it gave a surprising upsurge in the market.
At the moment, ETH/USD price is seen moving sideways within the channel and trading at $1799.20. In the scenario where it maintains the upward movement above the 9-day and 21-day moving averages, the buyers may likely find resistance at $2100, $2200, and $2300. Conversely, if the bears push the price below the channel, the sellers may have potential support at $1500, $1600, and $1500 levels.
The RSI (14) continues to move in the same direction as the price stuck in a range, which shows that the market is indecisive for now.
Against Bitcoin, the market price remained in the ascending channel currently trading at the support level of 3171 SAT and expecting a break out above the moving averages. Looking at the chart, we can see that the market keeps moving sideways. If the market continues to rise, the next key resistance may likely be at 3800 SAT and above.
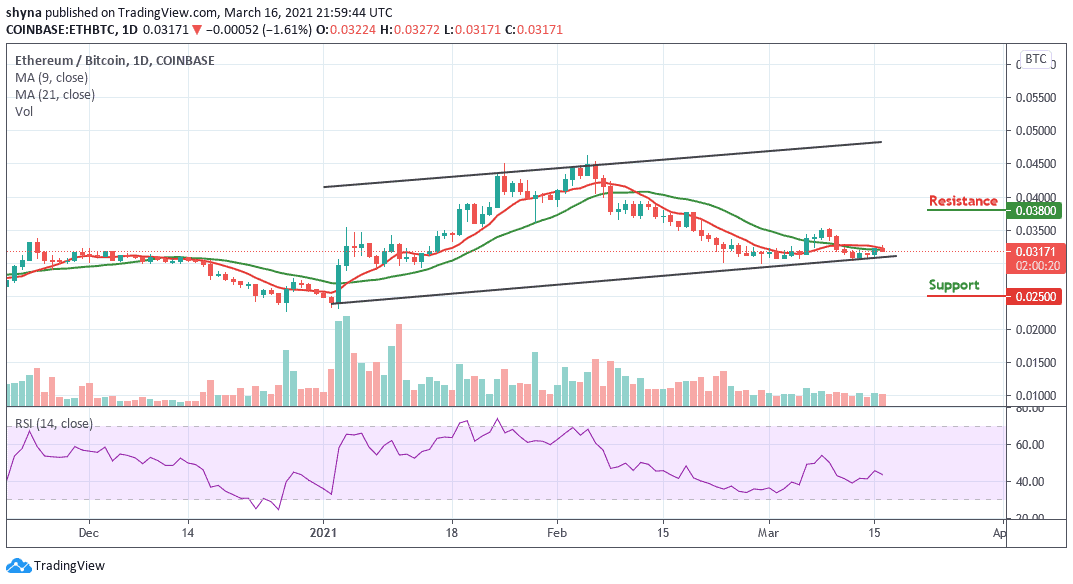
However, on the downside, a possible drop could bring the market below the moving averages which may visit the support level of 2500 SAT and below. According to the RSI (14), the market may start a downward trend, which could trigger more bearish signals in the market soon.


