

Bitcoin Price Prediction: BTC/USD Drops Below $54,000 after Rejection from $56,444

Bitcoin Price Prediction (BTC) – March 16
The Bitcoin price bounces back after a sharp drop as the coin moves to reclaim the $56,000 resistance level.
BTC/USD Long-term Trend: Bullish (Daily Chart)
Key levels:
Resistance Levels: $63,000, $65,000 $67,000
Support Levels: $48,000, $46,000, $44,000
BTC/USD pulls a shocking and devastating move against bullish investors following a tremendous fall from highs around $60,601 yesterday to touch the low of today at $53,221. At the time of writing, BTC/USD is trading 0.41% lower on the day and valued at $55,408. More so, the bulls failed to breach the $56,000 psychological level which happens to be one of the reasons why the coin is facing a downward trend.
Where is BTC Price Going Next?
Before the resumption of the upward trend, BTC/USD may likely retrace to the support level of $50,000. This could increase the chances of a rally above $62,500. However, once the price pulls back below the 21-day moving average, this is an indication that BTC/USD may be getting weaker at the moment. More so, the fear of a downward move may likely come to pass. For now, the RSI (14) is currently moving below 60-level, which indicates that the market is facing the south.
Expectantly, to sustain the upward movement, bulls will have to break above the 9-day moving average at the $58,000 resistance level. Further bullish movement may reach the potential resistance levels at $63,000, $65,000, and $67,000 respectively. While $48,000, $46,000, and $44,000 may serve as the major support levels, making room for the Bitcoin price to fall even further.
BTC/USD Medium-term Trend: Ranging (4H Chart)
Looking at the chart, BTC/USD is clearly facing a lot of resistance near the $56,000 level and a successful close above this level is a must for bullish acceleration. If not, there is a risk of a downside extension below the $54,000 support. If there is a downward move, the main support is near the $53,000 level, and below.
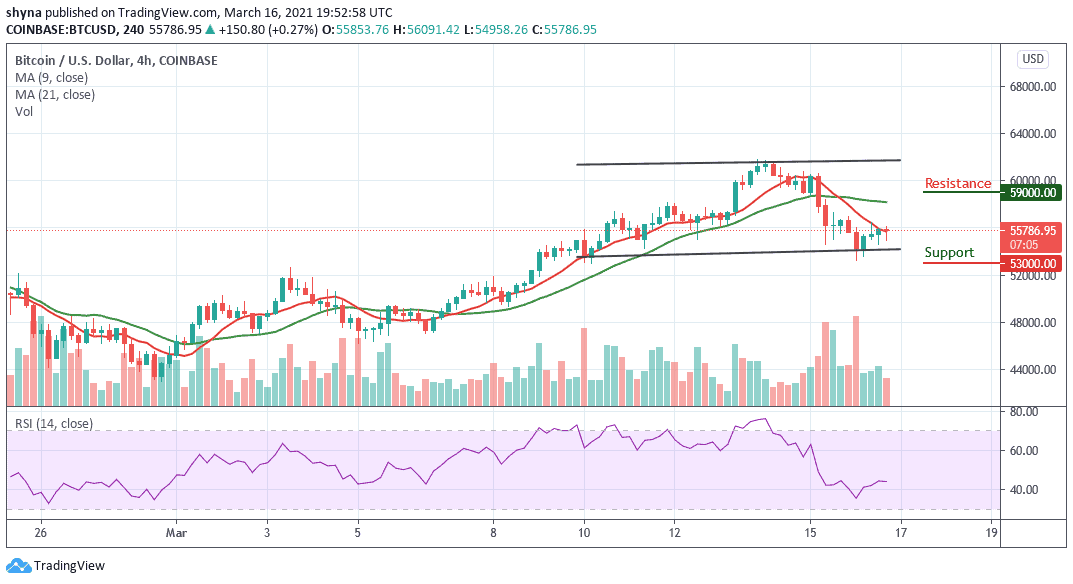
Furthermore, if there are more gains, the $56,000 level is likely to act as a major hurdle in the near term for Bitcoin. So if there is an upside break above the $57,500 resistance, the next stop for the bulls may perhaps be near the $59,000 and above as the RSI (14) moves above 40-level, which indicates that a bullish trend may come into play.


