

Bitcoin Price Prediction: BTC/USD Turns Positive as Price Revisits $58,000 Resistance

Bitcoin (BTC) Price Prediction – March 17
Bitcoin is currently trading at $58,000 after slipping below $55,000 at the beginning of today.
BTC/USD Long-term Trend: Bullish (Daily Chart)
Key levels:
Resistance Levels: $64,000, $66,000, $68,000
Support Levels: $49,000, $47,000, $45,000
BTC/USD is currently pushing higher as the latest move marks an upwards break of the consolidation phase seen as of late, but it is important to note that it has not led BTC past any key technical levels. Looking at the daily chart technically, BTC/USD has been making an attempt to maintain the bullish movement over the past few days but struggling to gain any momentum as the entire market’s uptrend stalls.
Where is BTC Price Going Next?
BTC/USD is trading up marginally above its current price of $58,081 as this only marks a tremendous climb from where it has been trading throughout the past several hours but it is important to note that this seems to mark a bullish break above the 9-day and 21-day moving averages.
Meanwhile, as the technical indicator RSI (14) moves above 60-level, a continuous bullish movement within this zone could locate the potential resistance at $60,000, reaching this may also allow for an extended recovery towards $64,000, $66,000, and $68,000 respectively. Nevertheless, should in case the technical indicator drops below 60-level, the market may experience a serious downward movement which may force the Bitcoin price to move towards the support levels of $49,000, $47,000, and $45,000.
BTC/USD Medium-Term Trend: Ranging (4H Chart)
According to the 4-hour chart, BTC/USD needs to remain above the 9-day and 21-day moving averages to mitigate the short-term bullish pressure and allow for an extended recovery towards $60,000. In addition, a higher resistance level may be found at $62,000 and above.
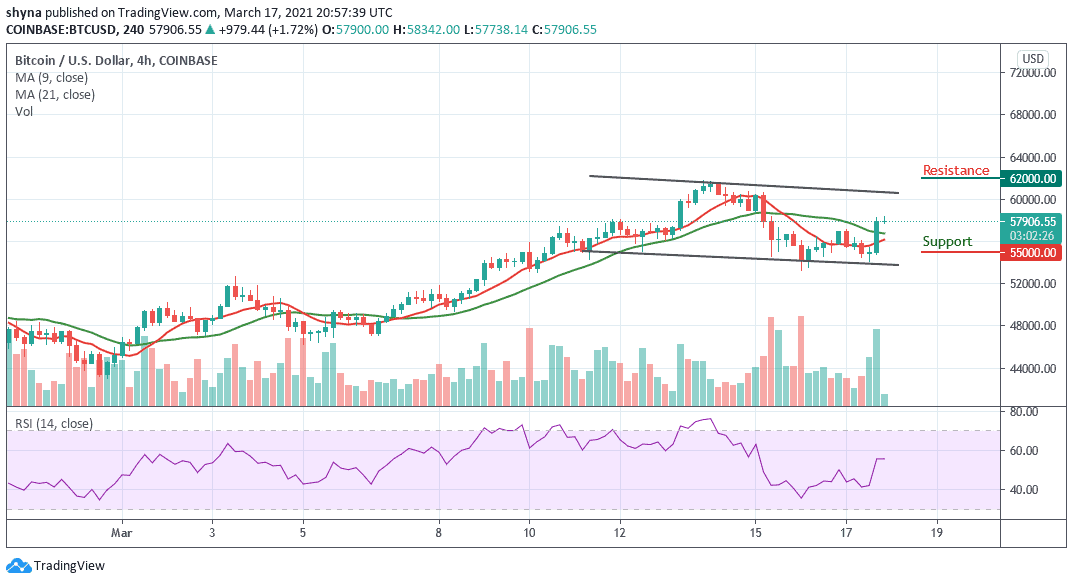
However, the nearest support is below the 9-day moving average at $55,800, and a critical move below this level may increase the downside pressure to the support level of $55,000 and below. Meanwhile, the technical indicator RSI (14) is staring at the downside as the signal line moves around 55-level.


