

Bitcoin Price Prediction: BTC/USD Swings Above $61,000

Bitcoin Price Prediction – October 23
The Bitcoin price restarts the uptrend after crossing above the critical barrier of $61,000 to touch the daily high of $61,750.
BTC/USD Long-term Trend: Ranging (Daily Chart)
Key levels:
Resistance Levels: $68,000, $70,000, $72,000
Support Levels: $55,000, $53,000, $51,000
BTC/USD looks green today as the price hovers above the resistance level of $61,000 from the low of $59,650. However, a daily close above the $61,000 level may continue to increase the Bitcoin price to $62,000. At the moment, all eyes focus on the next hurdle at $62,000. However, traders should note that a consistent price increase would encourage more investors to join the market as bulls increase their positions.
Bitcoin Price Prediction: Price May Break Higher
At the time of writing, the Bitcoin price is moving marginally at its current price of $61,295 with a bullish movement. According to the daily chart, this marks a meaningful climb from the opening price of $60,682 level, therefore, it is important to note that the current movement remains below the 9-day moving average and could also climb above this barrier if the bulls put more effort.
According to the daily chart, if the market decides to fall below the 9-day moving average, the Bitcoin price could go below the 21-day moving average, and if that barrier fails to hold the sell-off, traders could see a serious decline towards the support levels of $55,000, $53,000, and $51,000 respectively. All the same, any further bullish movement above the 9-day moving average may reach the resistance level at $68,000, $70,000, and $72,000 as the Relative Strength Index (14) moves above 60-level, suggesting a bullish signal into the market.
BTC/USD Medium – Term Trend: Ranging (4H Chart)
The 4-hour chart shows that the Bitcoin bears are still in play within the market keeping the Bitcoin price below the 9-day and 21-day moving averages. Although BTC/USD has not yet slipped below $60,000, it’s still in the loop of making a bounce back.
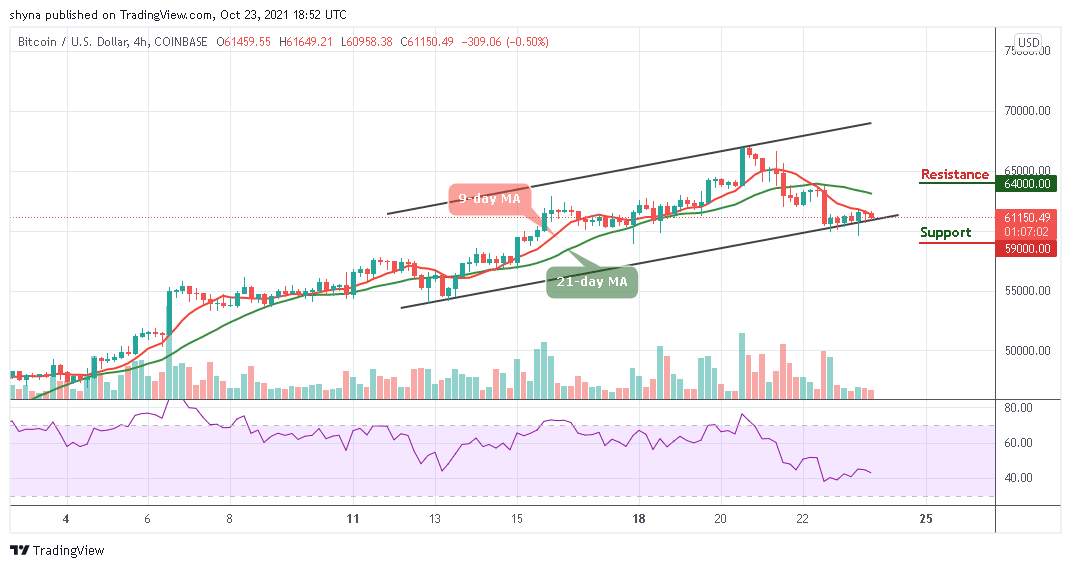
Moreover, the Bitcoin price is currently hovering below the 9-day and 21-day moving averages at the time of writing. The upward movement may likely push the price to the nearest resistance of $64,500 and above while the immediate support lies at $59,000 and below. The Relative Strength Index (14) is moving around the 45-level, which indicates sideways movement.
Looking to buy or trade Bitcoin (BTC) now? Invest at eToro!
67% of retail investor accounts lose money when trading CFDs with this provider
Read more:


