

Bitcoin (BTC/USD) Market Retraces to $60,000
 Market Retraces to ,000")
Bitcoin Price Prediction – October 23
It reported that the BTC/USD market retraces to the $60,000 level after a chain of higher variant points was achieved recently. The crypto-economic price trades around $61,520 at a percentage rate of about 0.99. That shows that the crypto business operation is striving against witnessing a further free-fall around the value line mentioned earlier.
BTC/USD Market
Key Levels:
Resistance levels: $65,000, $67,500, $70,000
Support levels: : $57,500, $55,000, $52,500
BTC/USD – Daily Chart
The BTC/USD daily chart reveals that the market retraces to $60,000. Unsustainable downward push against the point witnessed in the trading activities. The bullish channel trend lines are above the SMA trend lines. The lower side has breached southward by price. The 14-day SMA indicator is above the 50-day SMA indicator and, they are both under the current trading zone. The Stochastic Oscillators have swerved southbound freshly into the oversold region. That signifies that depression is somewhat ongoing.
Should traders focus more on the $60,000 level as the crypto market retraces to it?
The market value line at $60,000 appears to play a role in determining the subsequent price actions of the BTC/USD trade activities as the crypto market retraces to it. About a couple of failing attempts has come up recently to push further southward from the point. But they have turned to give a decent long entry. However, $55,000 also appears to be the critical support line that price may find hard to break down further if even that point earlier mentioned breached downward together with the immediate $57,500 support level. As a result, all hope shouldn’t lose while that assumption plays out afterward.
On the downside, October 21st bearish candlestick seems to have created a sell wall that the BTC/USD market bears may have to watch out for an upward price reversal motion that can occur at a higher line to get a sell entry. An aggressive northward push against the $65,000 level will nullify such presumption afterward, especially while the uprising pressure is devoid of stable reverses.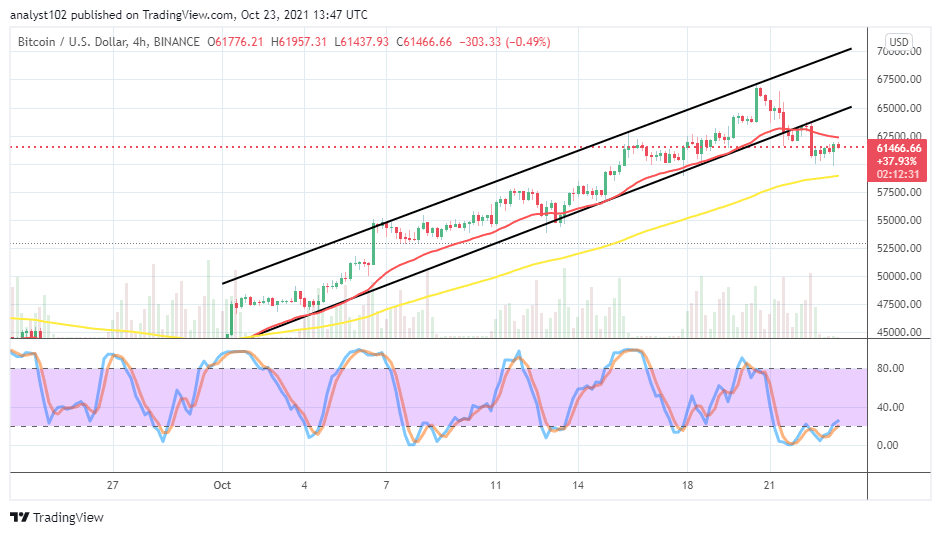
BTC/USD 4-hour Chart
The BTC/USD 4-hour chart depicted that the market retraces southward against the lower bullish channel trend line and the smaller SMA. The 14-day SMA indicator has briefly bent to the east above the 50-day SMA. Variant 4-hour candlesticks have emerged closely beneath the smaller SMA indicator. The Stochastic Oscillators are seemingly consolidating around the range of 20. In the wake of that, $62,500 and $60,000 levels would have to watch by traders. Bulls are likely to get the market’s control at the expense of bears’ weaknesses to retain positions below the lower trading value-line afterward.
Looking to buy or trade Bitcoin (BTC) now? Invest at eToro!
67% of retail investor accounts lose money when trading CFDs with this provider.
Read more:


