

Bitcoin Price Prediction: BTC/USD Now Battles with Pushing past the Key Resistance Point of $60,000

Bitcoin Price Prediction – March 13
In what looks like a tight-surviving stance for a stay above the key resistance line of $60,000, BTC has now to exert more pressure against the US Dollar to achieve just that. Any failing or relaxation attempt at this point of trading may see the crypto-market facing several price rejection moves around the main resistance level.
BTC/USD Market
Key Levels:
Resistance levels: $65,000, $70,000, $75,000,
Support levels: $50,000, $45,000, $40,000
BTC/USD – Daily Chart
It is depicted on the trading chart that the crypto-trade is again strongly mooning in strong price action to push beyond its previously achieved peak value. The 14-day SMA trading indicator has been left far below the current trading spot as it points to the northbound. And, the 50-day SMA trend-line is separated with space underneath the smaller SMA. Also, t points to the north direction. The Stochastic Oscillators are located within the overbought region with a slight-outlook of moving in consolidation in it. That signifies that more buying forces are ongoing.
Will BTC/USD succeed in breaching northbound above the $60,000 level?
In line with the kind of current forces being exhibit by the BTC/USD bulls, it is most likely that they are going to survive holding past above the main resistance value of $60,000 in a near session. Bulls will have to hold strong in their consolidation moving efforts to not leave a chance to any sudden resistant efforts by a small possible drop. While that scenario plays out, price may potentially get hiked to a new high of around $70,000 level in no time.
In the light of a bearish move, the BTC/USD bears will have to wait for a visible bearish engulfing about two preceding immediate formed candlesticks before considering finding a sell entry position of this crypto-market. That may as well not be coming on time going by the present buying spree exerting by the bulls. Therefore, considering any sell position will have to be backed up with every sense of cautiousness whenever a trader deems it fit.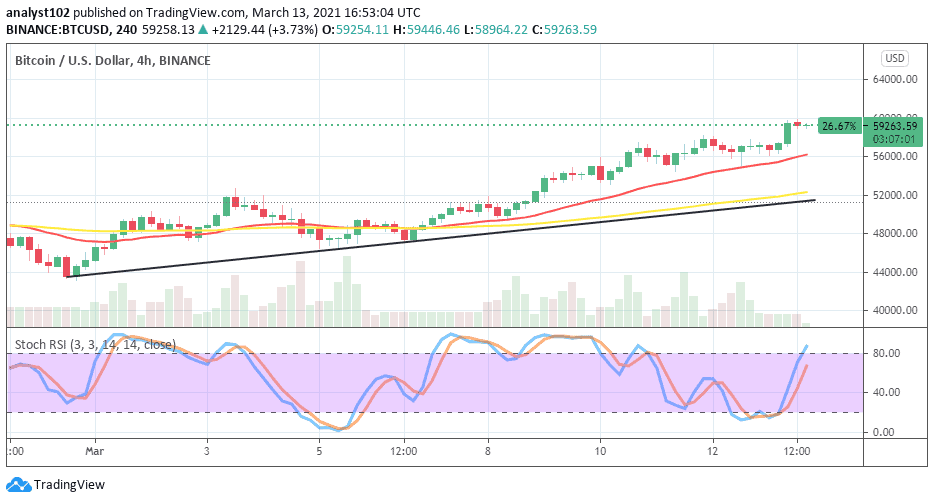
BTC/USD 4-hour Chart
The 4-hour trading chart depicts to showcase a kind of medium-term run of any trade-pair. Now, the kind of running outlook of the BTC/USD market still carries some degree of serial up-trends. That is to say, the US Dollar is still overwhelmed by the BTC trading position. All the trading indicators are in support of that ongoing bullish move as the 14-day SMA trend-line is located above the 50-day SMA pointing towards the north. The Stochastic Oscillators have swerved from range 40 to 80 slightly past into the overbought region. That indicates that more ups are yet to be exhausted in the BTC/USD market operations.


