

Bitcoin Price Prediction: BTC/USD Finally Conquers $60,000, Setting a New All-Time High

Bitcoin (BTC) Price Prediction – March 13
BTC/USD finally breached its previous all-time high of $58,000 and moves above the $60,000 level.
BTC/USD Long-term Trend: Bullish (Daily Chart)
Key levels:
Resistance Levels: $65,000, $67,000, $69,000
Support Levels: $53,000, $51,000, $49,000
BTC/USD is on a steady way up and it seems that there is nothing holding it back from reaching the higher level. After a tumultuous day of trading, the coin has just painted a new high for 2021 as it is currently trading at $60,276. The Bitcoin price spiked above $60,400 as the market remains above the 9-day and 21-day moving averages.
Where is BTC Price Going Next?
The price of Bitcoin is trading comfortably towards the upper boundary of the channel as the price establishes a new bullish signal. As matter of fact, the long-term outlook now favors the bulls, giving the daily close produced a large bullish engulfing candle with eyes now set on the daily resistances at $65,000, $67,000, and $69,000 respectively.
However, any rejection at the current level could eventually lead to declines to the critical support below the moving averages. In case BTC drops and touches the low of $55,000 support, then the coin can rely on the long-term support levels at $53,000, $51,000, and $49,000. Moreover, the technical indicator RSI (14) now moves into the overbought region, suggesting more bullish signals.
BTC/USD Medium-term Trend: Bullish (4H Chart)
According to the 4-hour chart, the Bitcoin price is seen touching the daily high at $60,840. However, today’s price move happens to be the most impressive one as it climbs above the long-awaited resistance level of $60,000 with a sharp upsurge. More so, BTC/USD is now maintaining its bull-run above $60,700 as the RSI (14) moves above 70-level.
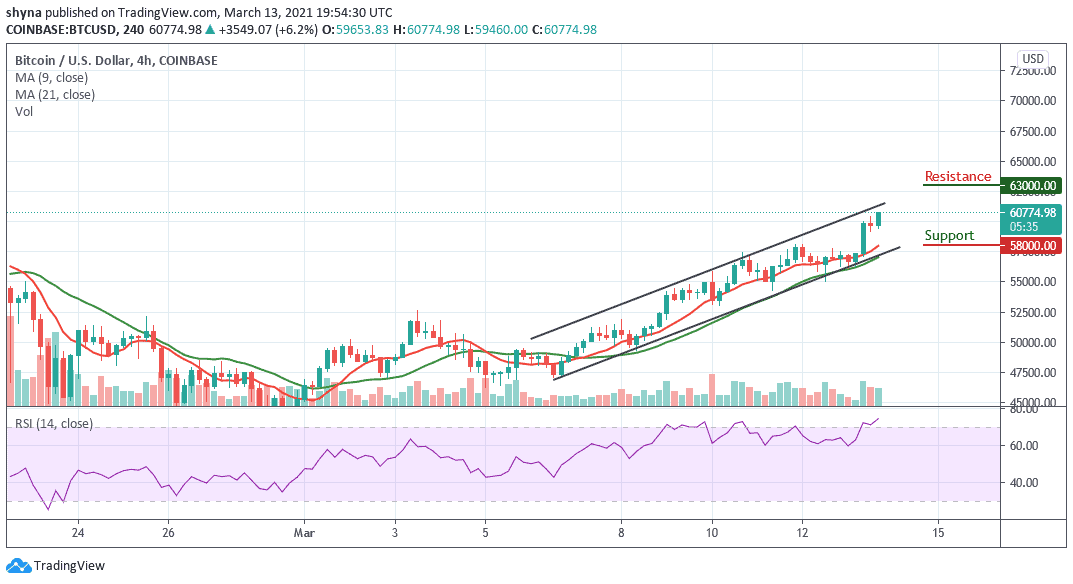
However, BTC may take a downward move if the bulls failed to push the price higher again. Therefore, the coin may breach below the 9-day and 21-day moving averages and could reach another support at $58,000 and below. Nevertheless, if the bulls find a decent resistance level of around $60,000, the coin may continue bullish movement above the channel at the resistance level of $63,000 and above.


