

Bitcoin Price Prediction: BTC/USD Currently Trades Around the $60,000 Resistance Mark-Up

Bitcoin Price Prediction – March 18
BTC/USD market is again appeared getting set for a sustainable break out of the main resistance level around $60,000 high-value. The crypto had experienced a short-lived price retracement after trading past the high-marked value recently.
BTC/USD Market
Key Levels:
Resistance levels: $65,000, $70,000, $75,000
Support levels: $50,000, $45,000, $40,000
BTC/USD – Daily Chart
The BTC/USD daily trading chart shows a line of small higher-downs and, now lower-ups once again averaging the most-recently new high-value of $60,000 level. With the formation of bullish shadow candlesticks having had around the support of the $55,000 line, it is believed that the crypto will surge further northwardly beyond the last achieved peak point. The two SMA indicators; 14 and 50 are below the market-trading path pointing in support to the north. The Stochastic Oscillators have moved from the overbought region to place closer to range 40 as they are now attempting to cross the hairs to the north. That suggests the possibility of getting back to see a degree of up-swings soon.
Will the BTC/USD price sustains trading past the key resistance of the $60,000 line?
Currently, the major support for the BTC/USD bulls to make a move back into a continued upward trend in this crypto-economy has been launched around the $55,000 price level. As of the time of writing, buying pressures are on a high-promising outlook which can potentially propel the bullish trend out of the resistant trading zone at the $60,000 line. After a successful trading past of it, other resistant forces may be experienced between the higher levels of $65,000 and $70,000.
As regards seeing a downturn move of this crypto-market, the BTC/USD bears will have to be on the lookout for a test of the $70,000 or variant price move rejections closer below it before cautiously exerting a sell position with good principles of a trading guide. However, that assumption isn’t expected in the near session.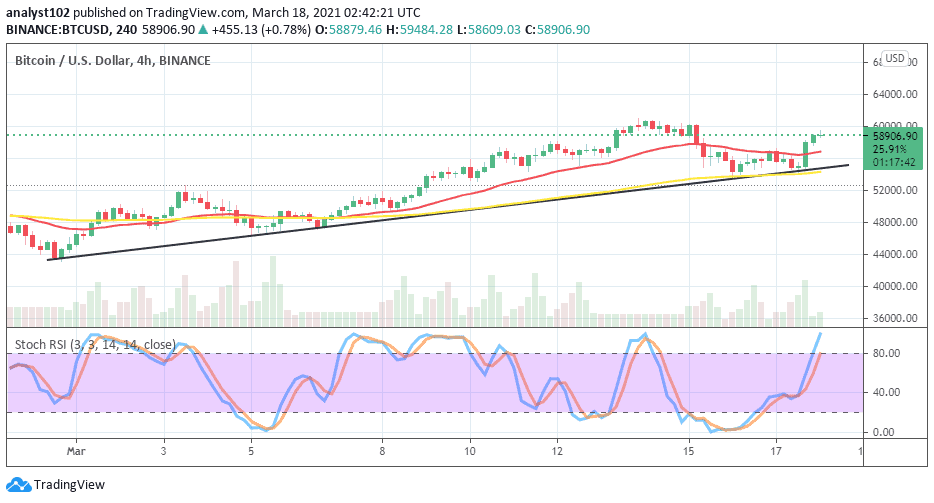
BTC/USD 4-hour Chart
It has over the time being shown on the BTC/USD 4-hour trading chart that the crypto’s value as paired with the US Dollar has been enjoying a substantial level of increase. The situation remains as price trades above the buy signal side of the 14-day SMA presently around $59,000 point. The 50-day SMA trend-line is located below the 16-day SMA as they are more of pointing to the north than east. The Stochastic Oscillators have freshly moved into the overbought region. Yet, they point towards the north within it. That signifies that swing-high is ongoing.


