

Bitcoin Price Prediction: BTC/USD Closes to $60,000 Resistance as Correction Lingers

Bitcoin (BTC) Price Prediction – March 18
The Bitcoin price is slightly under $59,000 amid the struggle to extend the bullish leg above $60,000.
BTC/USD Long-term Trend: Bullish (Daily Chart)
Key levels:
Resistance Levels: $68,000, $70,000, $72,000
Support Levels: $50,000, $48,000, $46,000
BTC/USD has been in an on-going uptrend since the beginning of this year, as the market price traded above the first-ever high of $61,000. Presently, the Bitcoin price is seen trading close to $60,000 resistance as the coin finds its way back to the top. Initially, trading above $60,000 has been an uphill battle for the coin, while most of the price actions above $60,000 stalled around this level.
What to Expect from Bitcoin
The break above $62,000 is going to be a big step for Bitcoin bulls as this will allow them to expand their scope above $60,000 which has always been a restriction for the coin. Note that Bitcoin is trading above the 9-day and 21-day moving averages, which could still bring massively bullish signals for the market. But if the price should slump below the moving averages, the $52,000 level could be an important zone to keep an eye on. Once bulls flip this level into support, the next major supports for the world’s leading crypto could be $50,000, $48,000, and $46,000.
However, moving past the recent high of $59,576 and turning this area into support could see Bitcoin rise to $62,000 or higher. While the king coin begins to hover around the $62,000 zone, there are two crucial price levels to pay attention to. The underlying support at $60,000 and the overhead resistance at $65,000 will help determine where prices are headed next as the potential resistance levels are located at $68,000, $70,000, and $72,000. Meanwhile, the technical indicator RSI (14) suggests a sideways movement as the signal line moves above 60-level.
BTC/USD Medium-Term Trend: Ranging (4H Chart)
According to the 4-hour chart, BTC/USD needs to remain above the 9-day and 21-day moving averages to mitigate the short-term bullish pressure and allow for an extended recovery towards $60,000. In addition, a higher resistance level may be found at $62,000 and above.
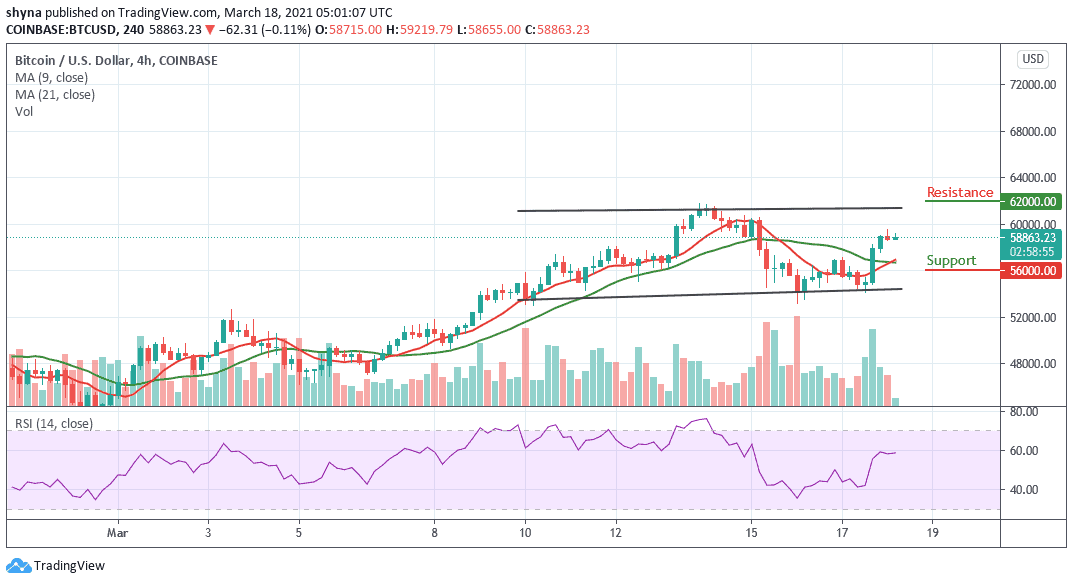
On the other hand, the nearest support is below the moving averages at $56,500, and a critical move below this level may increase the downside pressure to the support level of $56,000 and below. Meanwhile, the technical indicator RSI (14) is staring at the sideways movement as the signal line moves below the 60-level.


