

BTC Price Rises 4% To $62K As Bitcoin ETF approval looks certain

- The current BTC price bull run has seen the big crypto brush shoulders with $62 K.
- Bitcoin’s daily trading volume has once again returned to over $45 billion.
- A closure above the all-time high above $64,000 could see BTC explore uncharted territories as bulls aim for $100,000 before the end of the year.
BTC price is trading at $61,814 with a bullish bias after rallying approximately 4% over the last 24 hours with a daily trading volume of $45,431,174,952 which has itself increased by 14.56% over the same period. Bitcoin price has surged more than 12% over the last seven days. This rally that began on October 01 has seen the bulls push the big crypto up 46% from a low of $43,124 on October 01 to brush shoulders with $62K on Friday.
Bitcoin price spiked above to around $62,953 as the promise of SEC BTC ETF approval appeared certain igniting a discussion on whether the flagship cryptocurrency will reach the $100,000 mark by the end of 2021.
The positive Bitcoin price sentiment follows news pointing to the inevitable approval of Bitcoin Exchange Traded Fund (ETF) by the US SEC.
Data from
However, if things go awry for the Bitcoin bulls, we could see a retracement for BTC price below $60,000 or even $58,000 support walls should the bellwether cryptocurrency fail to sustain the current bullish momentum.
BTC Price Prepares For A Massive Breakout
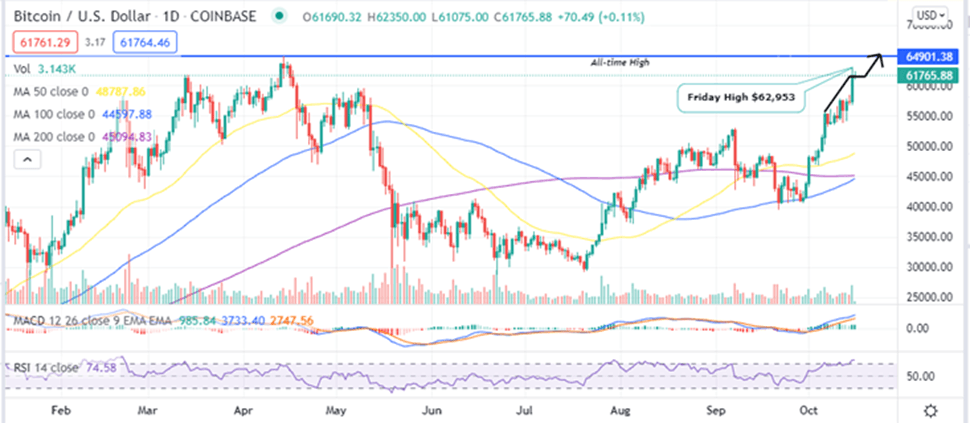
At the time of writing, Bitcoin price is hovering around $61,765.88, around 5% short of the April 14 ATH. This is the last barrier that is standing in BTC’s way from exploding to new record highs.
From this outlook, if Bitcoin can manage a close above the ATH above $64,000, there is a potential for an ”exponential upside” as BTC price discovery faces relatively little resistance zones while bulls will attempt for a go at $100,000.
This bullish outlook is accentuated by the fact that the BTC/USD price is trading above the October rising trendline with the upsloping 50-, 200-, and 100-day Simple Moving Averages (SMAs) providing robust support at $48,790, $45, 095 and $44,599 respectively. Its relative strength index (RSI) is positioned at 75 in the overbought territory and the upward movement of the Moving Average Convergence Divergence (MACD) indicator above the zero line in the positive region validate Bitcoin’s bullish outlook.
BTC/USD Daily Chart
However, if things go awry for the Bitcoin bulls, we could see a retracement for BTC price below $60,000 or even $58,000 support walls should the bellwether cryptocurrency fail to sustain the current bullish momentum.
Looking to buy or trade Bitcoin (BTC) now? Invest at eToro!
67% of retail investor accounts lose money when trading CFDs with this provider
Read More


