

Bitcoin Price Prediction for Today, September 17: BTC Hovers Around

Bitcoin Price Prediction – September 17
The BTC/USD market hovers around the $20,000 psychological trading line. The value line has long been the trading zone showcasing an in-sustainable downward-trending force underneath the value line. About seven days ago, price traded between $19,400.08 and $22,673.82 points.
Bitcoin (BTC) Statistics:
BTC price now – $19,846.60
BTC market cap – $379.8 billion
BTC circulating supply – 19.2 million
BTC total supply – 19.2 million
Coinmarketcap ranking – #1
BTC/USD Market
Key Levels:
Resistance levels: $22,500, $25,000, $27,500
Support levels: $17,500, $15,000, $12,500
BTC/USD – Daily Chart
The BTC/USD daily chart showcases the crypto market hovers around the lower range value line at the $20,000 logical level. A bearish candlestick emerged, breaching the trend line of the 14-day SMA at $20,674.56 to the downside, underneath the 50-day SMA indicator, which is at $23,337.15. The upper range line remains drawn at the $25,000 resistance level. The Stochastic Oscillators have moved southbound from the overbought region to reach the 44.23 and 42.24 range lines. If the blue line crosses back the red line to the upside, the market will tend to rebound in no time.
Your capital is at risk.
Will the BTC/USD market lower past the $20,000 psychological level this time?
It is not yet; whether the BTC/USD market will lower sustainably past the $20,000 psychological level as the trade hovers around the value line. It may be indefinitely taking another round of sessions before bulls regain their capacity to push back the crypto economy’s worth to higher points from its current trading zone. In other words, trading activities will prolong moving in a less-active mode for some time.
On the downside of the technical analysis, a trading resistance point has set in around the trend line of the 14-day SMA for short-position takers who would like to exert a selling order at all costs going by the market’s pace. From the technical viewpoint, the running down of the trade below the lower range line drawn may not keep for a long time. Based on that sentiment, short-position takers have to be wary of executing new sell orders at the point this time.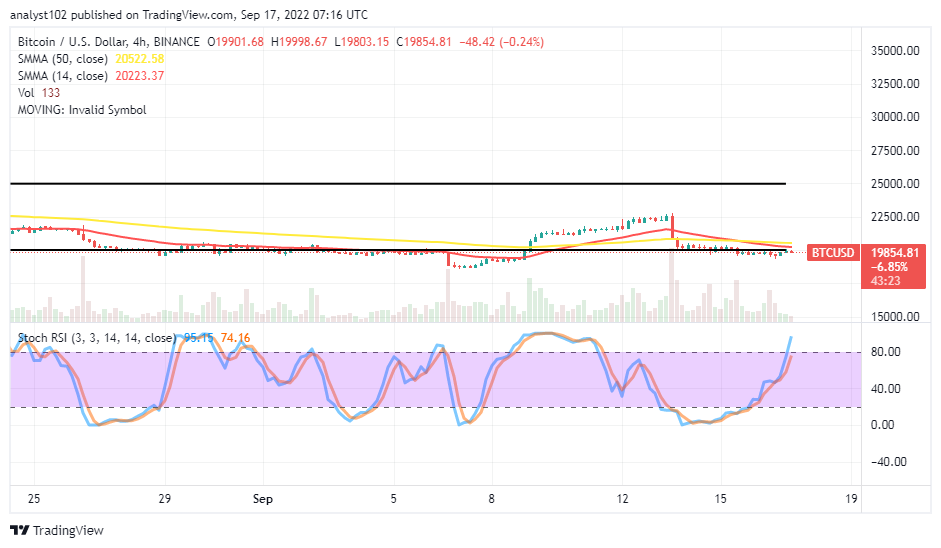
BTC/USD 4-hour Chart
The BTC/USD medium-term chart reveals the crypto business hovers around the $20,000 psychological trading level over a long period. Some days ago, the market encountered resistance around the middle range-bound trading points of $22,500. The 14-day SMA is at $20,223.37, underneath the $20,522.58 value line of the 50-day SMA indicator. The Stochastic Oscillators have swerved northbound from the oversold region. And they are at 74.16 and 95.15 range points. The reading situation still suggests there may be other rounds of range-moving mode around the lower horizontal trading line.
Tamadoge – Play to Earn Meme Coin

- Earn TAMA in Battles With Doge Pets
- Capped Supply of 2 Bn, Token Burn
- NFT-Based Metaverse Game
- Presale Live Now – tamadoge.io
Read more:


