

Bitcoin Price Prediction: BTC/USD yet Faces a Strong Resistance Level of $60,000

Bitcoin Price Prediction – March 12
It once again observed that the BTC/USD market valuation is currently encountering a key resistance spot closer to the level of $60,000 as the crypto-trade makes another round move of surging northwardly further.
BTC/USD Market
Key Levels:
Resistance levels: $60,000, $65,000, $70,000,
Support levels: $50,000, $45,000, $40,000
BTC/USD – Daily Chart
It still seemly depicted on the trading chart that the BTC/USD market may tend to repeat a slight downturn as a bearish candlestick features in the making as at the time of writing just around the same spot as it did on February 22 session. Nevertheless, it is expected that the presumed downward may have to go through some days of trading before touching support of $50,000. The 14-day SMA is placed around the level mentioned earlier and, the 50-day SMA trend-line is underneath it pointing to the north direction. The stochastic Oscillators have moved into the overbought region. They have crossed the hairs within it. That shows that another directional pattern may soon occur in the crypto-economy.
What could be the BTC/USD next market’s direction?
The BTC/USD bulls have been having a dominant role over time as regards this crypto-trade activity. At this point of trading, it may only take a while as the crypto will have to see another slight lowering in values to locate a better stand for a decent spike to signal a good bullish trend continuation. By the time that that assumption comes to play, the $60,000 resistance point will be breached past northwardly so that the crypto will be able to keep a higher value.
From the perspective of a downward trend, the BTC/USD bears will have to keep informed as to whether price will once again be resisted around the $60,000 level to pave way for a good sell position. A prolonged less-active may the crypto-trade featuring a chain of variant higher lows around the current trading spot of $55,000 line. However, traders need to wait for active price action before considering joining a movement.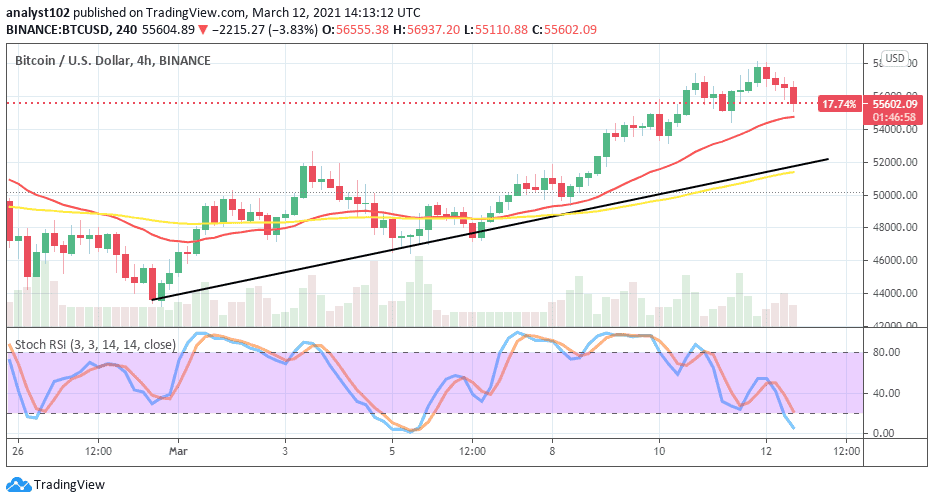
BTC/USD 4-hour Chart
On the 4-hour trading chart, it shows that BTC is having an upper hand on the market worth of the US Dollar presently. The crypto pair’s journey to the north has been firmly established as price trades on both sides of the two SMA indicators. The 14-day SMA is above the 50-day SMA pointing to the north. The Stochastic Oscillators have slightly moved into the oversold region. They appear like crossing the hairs soon around it. Therefore, bulls will find support quickly around the $54,000 level. That said, a breakdown of it will cause a lowering extension of rebuilding support around the $52,000 line.


