Bitcoin Price Prediction: BTC/USD Tumbles Below $60,000

Bitcoin Price Prediction – November 17
As reveals by the daily chart, the Bitcoin price keeps extending the bearish movement below $60,000 after numerous trials to sustain gains.
BTC/USD Long-term Trend: Ranging (Daily Chart)
Key levels:
Resistance Levels: $67,000, $69,000, $71,000
Support Levels: $53,000, $51,000, $49,000
BTC/USD falls toward $58,000 as the largest cryptocurrency embarks on a support smashing exercise after failing to hold above $60,000 following a significant breakout early this month. However, across the market, the bearish control is seen with other major digital assets posting losses as they all trade below the 9-day and 21-day moving averages.
Bitcoin Price Prediction: BTC Price Correction May Deepens
The Bitcoin price is trading at $59,502 with an intraday loss of 1.01% as the prevailing trend within the market is bearish with expanding volatility. However, the king coin is currently moving sideways in a bearish flag pattern. Nevertheless, a break down from this pattern may likely continue in the direction of the previous trend and BTC/USD is expected to stay below 9-day and 21-day moving averages which could move towards the critical support levels at $53,000, $51,000, and $49,000.
However, should Bitcoin price crosses above the moving averages; the price could rise to $65,000 vital resistance. A further bullish drive could push the price to $67,000, $69,000, and $71,000 resistance levels. The technical indicator Relative Strength Index (14) is revealing a bearish sign, which shows more bearish momentum coming to play out.
BTC/USD Medium – Term Trend: Ranging (4H Chart)
At the opening of the market today, the Bitcoin price touches the high of $60,385 but seen dropping slightly within 24 hours, bringing its price from $60,385 to reach around $59,440. Should the price continue to drop further and keep moving below the 9-day and 21-day moving averages, it could reach the nearest support level at $57,000 and below.
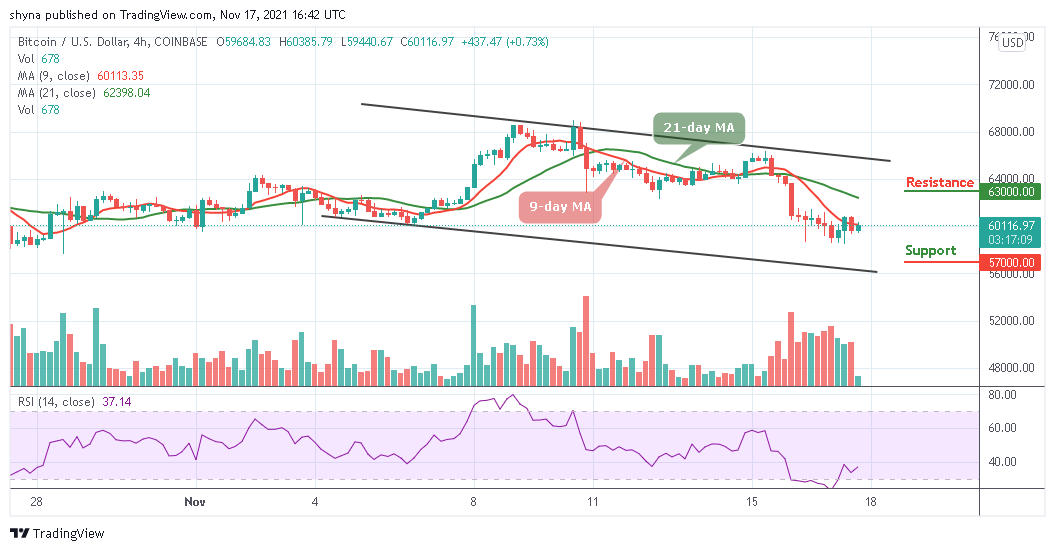
Moreover, if the bulls push the coin above the 21-day moving average, the Bitcoin price could reach the potential resistance level of $63,000 and above. Presently, the market may continue to move sideways or experience an uptrend as the Relative Strength Index (14) indicator moves to cross above 40-level.
Looking to buy or trade Bitcoin (BTC) now? Invest at eToro!
68% of retail investor accounts lose money when trading CFDs with this provider
Read more: