

Bitcoin Price Prediction: BTC/USD Swings Above $57,000 Resistance

Bitcoin Price Prediction – December 3
The Bitcoin price prediction shows that LTC is likely to restart the uptrend after touching the daily low of $56,111.
BTC/USD Long-term Trend: Ranging (Daily Chart)
Key levels:
Resistance Levels: $63,000, $65,000, $67,000
Support Levels: $50,000, $48,000, $46,000
BTC/USD looks green today as the price hovers above the resistance level of $57,000 from the low of $56,111. However, a daily close above the $58,000 level may continue to increase the Bitcoin price to $60,000. However, traders should note that a consistent price increase may bring more buyers into the market as bulls increase their positions.
Bitcoin Price Prediction: Price May Begin to Break Higher
In the past few hours, after the Bitcoin price touches the daily high of $57,670, the first digital asset is now looking forward to touch another resistance level of $58,000. Moreover, the daily chart reveals that if the 9-day moving average crosses above the 21-day moving average, it will keep the coin at the upside.
Meanwhile, the bears may take advantage to break below the $55,000 level if the bulls fail to move the price above the 9-day and 21-day moving averages. Meanwhile, the technical indicator Relative Strength Index (14) is likely to cross above 45-level. More so, if the Bitcoin price crosses above the moving averages, it could hit the resistance levels of $63,000, $64,000, and $66,000 but facing the south may bring the price to the supports at $50,000, $48,000, and $46,000.
BTC/USD Medium – Term Trend: Ranging (4H Chart)
According to the 4-hour chart, the Bitcoin price is hovering below the 9-day and 21-day moving averages. However, intraday trading is ranging as the coin moves toward the lower boundary of the channel which could reach the support level at $55,000 and below.
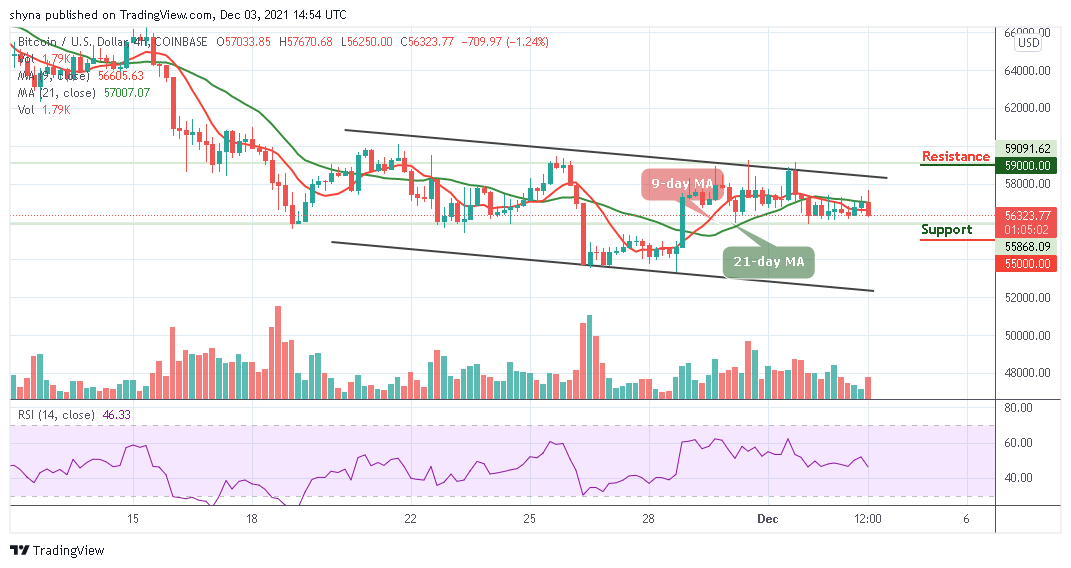
On the contrary, if the buyers push the market upward, traders can expect a rise above the 9-day and 21-day moving averages, and breaking this barrier may further push the price above the upper boundary of the channel to reach the resistance level of $59,000 and above. Meanwhile, the technical indicator Relative Strength Index (14) is seen moving below 50-level, suggesting more bearish signals.
Looking to buy or trade Bitcoin (BTC) now? Invest at eToro!
68% of retail investor accounts lose money when trading CFDs with this provider
Read more:


