Bitcoin Price Prediction: BTC/USD Suffers a Sudden 4.54% Drop

Bitcoin Price Prediction – May 28
The Bitcoin price is seen dropping from $38,556 to $35,127 in hours but the coin is currently managing to recover.
BTC/USD Long-term Trend: Bearish (Daily Chart)
Key levels:
Resistance Levels: $45,000, $50,000, $55,000
Support Levels: $30,000, $25,000, $20,000
At the time of writing, BTC/USD is trading down marginally at its current price of $36,808. This is around the price at which it has been trading throughout the past few days. However, the Bitcoin price is falling below $38,000, and undergoing rejections at $38,900 is not positive for the bull case. Although the bulls have tried and failed on multiple separate occasions to gather enough buying pressure to break $40,000, each attempt has failed simultaneously.
Bitcoin Price Prediction: What Is the Next Direction for Bitcoin?
The Bitcoin price is currently trading below the 9-day and 21-day moving averages at $36,808 after an attempt by the bears to take the price down to $35,000. The move happened in less than one hour after Bitcoin dropped below 9-day MA at $36,000 which is an important support level on the daily chart but the bulls managed to bounce back up from $35,127 to $36,808 where it is currently.
It is important to note that Bitcoin’s inability to post any sustained closes above the $40,000 region shows that it is currently plagued by underlying weakness. This consolidation phase has given rise to a plethora of bearish divergences that may cause the cryptocurrency to see a notable retrace in the days ahead.
Moreover, the potential resistance levels for the coin are located at $45,000, $50,000, and $55,000 while the critical supports lie at $30,000, $25,000, and $20,000 as the Relative Strength Index (14) moves down into the oversold region, suggesting more bearish signals.
BTC/USD Medium-Term Trend: Bearish (4H Chart)
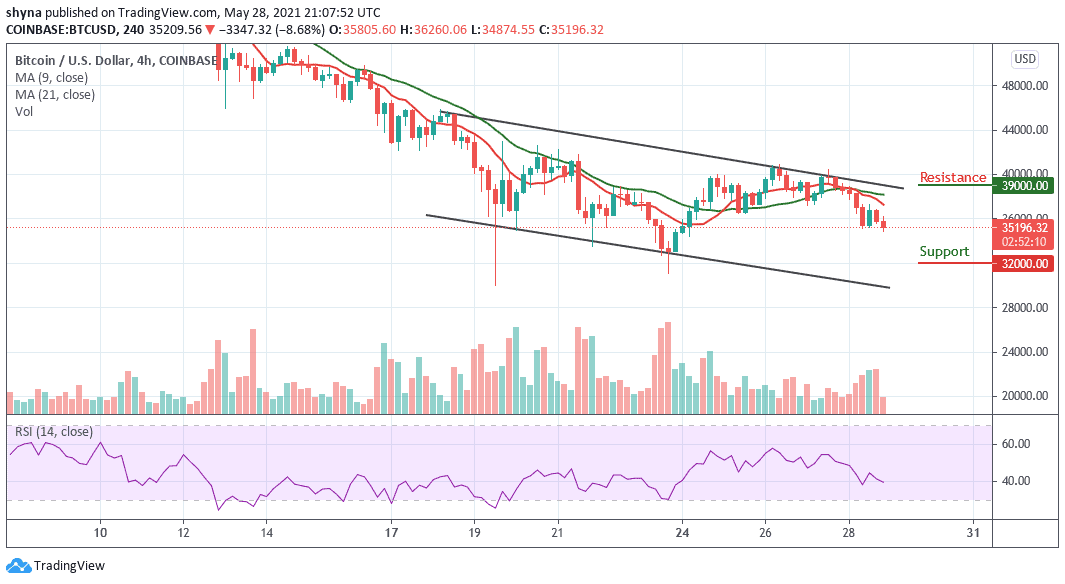
According to the 4-Hour chart, the immediate support is below the 9-day and 21-day moving averages at the $35,196 level. The price may likely fall below $34,000 if the bears fully stepped back into the market, a further movement could test the critical support at $32,000 level and below while the resistance is located above the moving averages at $39,000 and above. Technically, Bitcoin is currently moving towards the south as the Relative Strength Index (14) moves to cross below 40-level.