

Bitcoin Price Prediction: BTC/USD Retreat May Bring Recovery to $70,000

Bitcoin Price Prediction – November 12
The Bitcoin price rests above $63,500 after the retreat from levels $62,300 as further downside momentum appears to be imminent.
BTC/USD Long-term Trend: Ranging (Daily Chart)
Key levels:
Resistance Levels: $70,000, $72,000, $74,000
Support Levels: $58,000, $56,000, $54,000
BTC/USD is currently hovering at $63,852 after losing 1.47% of its value today. More so, where Bitcoin will go next is likely to depend on the ability of the bulls to hold the price above the key support at $63,500 which is above the 9-day and 21-day moving averages.
Bitcoin Price Prediction: Bitcoin (BTC) May Drop Slightly
Looking at the daily chart, the Bitcoin price is still facing the south as the coin still remains above the 9-day and 21-day moving averages. However, a further retracement seems to be imminent and it is likely for the coin to break below 9-day moving average. Meanwhile, looking at the chart, $58,000, $56,000, and $54,000 serve as the major support levels, making room for BTC to fall even further.
Moreover, the technical indicator Relative Strength Index (14) is likely to drop further, suggesting a slightly bearish movement. However, as the daily chart reveals, if the bulls resume back into the market and push the Bitcoin price towards the upper boundary of the channel, BTC/USD may see resistance level at $65,000, any further movement could send it to the potential resistance levels of $70,000, $72,000, and $74,000 respectively as the technical levels remain negative.
BTC/USD Medium-Term Trend: Ranging (4H Chart)
Looking at the 4-hour chart, the bears are making efforts to step back into the market but the bulls are holding the nearest support by picking the price from $63,177 to where it is currently trading at $63,650 which is below the 9-day and 21-day moving averages. Meanwhile, the $66,000 and above may come into play if BTC/USD crosses above the 9-day and 21-day moving averages.
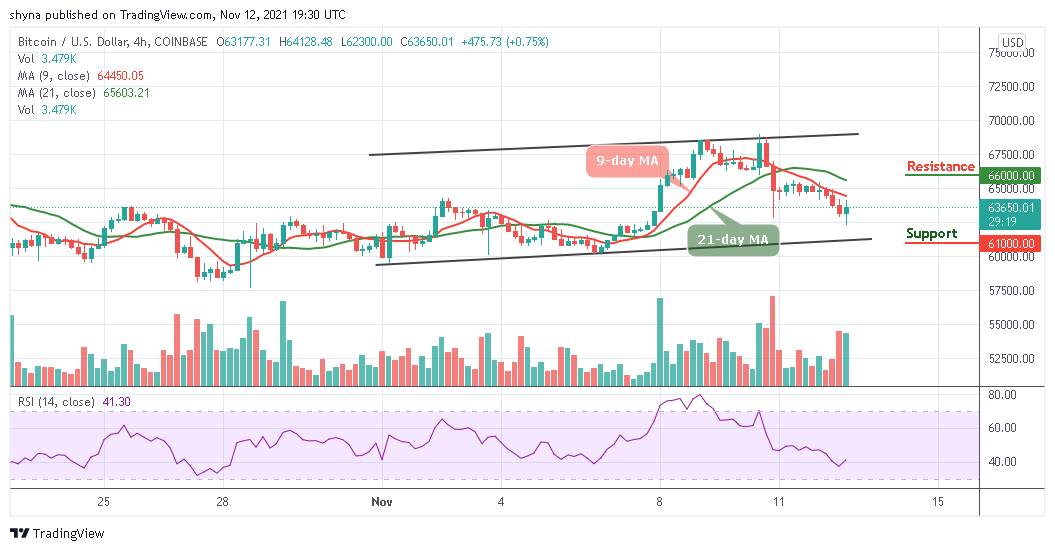
However, if the price breaks below the lower boundary of the channel and begin to fall, the support level of $61,000 and below may come to focus. Meanwhile, as the Relative Strength Index (14) moves around 40-level, more bearish signals may play out before a reversal could come in.
Looking to buy or trade Bitcoin (BTC) now? Invest at eToro!
68% of retail investor accounts lose money when trading CFDs with this provider
Read more:


