Bitcoin Price Prediction: BTC/USD Retraces Below $64,000

Bitcoin Price Prediction – November 14
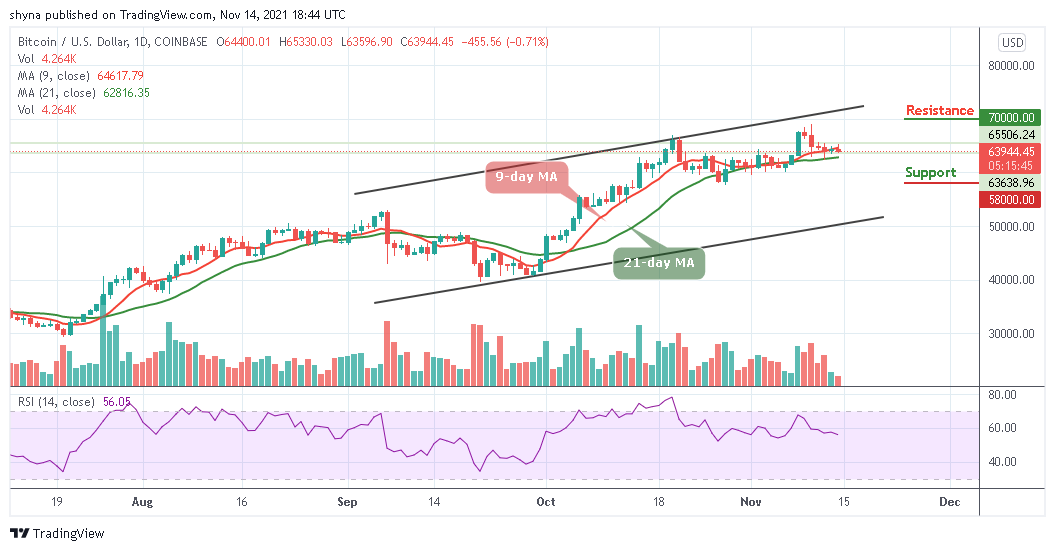
According to the daily chart, the Bitcoin price is likely to follow the bearish momentum as further upside may be rejected for now.
BTC/USD Long-term Trend: Ranging (Daily Chart)
Key levels:
Resistance Levels: $70,000, $72,000, $74,000
Support Levels: $58,000, $56,000, $54,000
BTC/USD is currently facing a setback as this current movement might be a permanent one if the red-line of the 9-day moving average crosses below the green-line of the 21-day moving average. However, the king coin is likely to have a bearish movement in the short-term as a price rally may help the coin to touch its daily low. Currently, Bitcoin (BTC) is trading around $63,944 level after a free fall from $65,330.
Bitcoin Price Prediction: Can Bitcoin Price Touch $68k High Again?
The technical indicator Relative Strength Index (14) reveals that the signal line is moving towards the east and it is likely for the Bitcoin price to slide and face the downtrend. Meanwhile, despite the sideways movement, the Relative Strength Index (14) is still hovering below 60-level and this could mean that bulls may resurface if the Bitcoin price crosses back above 60-level and the king coin could stay above the 9-day and 21-day moving averages.
On the upside, recovery may not come easy but a sustainable towards the upper boundary of the channel may locate the nearest resistance at $68,000, which may allow for an extended recovery towards the potential resistance levels at $70,000, $72,000, and $74,000. However, an increase in selling pressure below the moving averages could force the Bitcoin price towards a critical supports at $58,000, $56,000, and $54,000.
BTC/USD Medium-Term Trend: Ranging (4H Chart)
On the 4-hour chart, the Bitcoin price stays trading below the 9-day and 21-day moving averages as the market price is trying to recovery from the bearish momentum. However, the Bitcoin price is likely to return to the bull market if the price breaks above the 9-day and 21-day moving averages. Meanwhile, higher resistance could be located at the $65,000 while the technical indicator Relative Strength Index (14) remains below 50-level.

On the other hand, if the bearish movement continues, the support level of $64,000 may not be able to hold the selling pressure. More so, BTC/USD is likely to fall to $62,000 and below if the price falls below the lower boundary of the channel.
Looking to buy or trade Bitcoin (BTC) now? Invest at eToro!
68% of retail investor accounts lose money when trading CFDs with this provider
Read more:


