

Bitcoin Price Prediction: BTC/USD Retraces Below $57,000

Bitcoin Price Prediction – December 2
The Bitcoin price indicates bearish momentum as further upside got rejected and bullish momentum seems to be lost.
BTC/USD Long-term Trend: Ranging (Daily Chart)
Key levels:
Resistance Levels: $62,000, $64,000, $66,000
Support Levels: $52,000, $50,000, $48,000
At the time of writing, BTC/USD is hovering at $57,755. There have been instances when BTC slides below $56,000 to touch the daily low of $55,845. At the time of writing, the first digital asset continues to follow sideways movement while the daily chart shows that the formation of a bearish may come to play.
Bitcoin Price Prediction: BTC Price May Head Downwards
The daily chart shows that the Bitcoin price is currently ranging as the technical indicator Relative Strength Index (14) is likely to cross below 45-level. With the look of things, BTC/USD is not yet done with the downside as the 9-day moving average is still below the 21-day moving average. This could mean that there may still be a room that could be explored by the bears and the Bitcoin price may continue to move in the direction.
According to the daily chart, the Bitcoin price is yet to work on its recovery towards the 9-day and 21-day moving averages. Meanwhile, a sustainable move towards the upper boundary of the channel may locate the resistance level of $60,000, which may allow for an extended recovery towards the resistance levels of $62,000, $64,000, and $66,000. Therefore, any further bearish movement could force the Bitcoin price to touch the support levels of $52,000, $54,000, and $56,000.
BTC/USD Medium-Term Trend: Ranging (4H Chart)
The 4-hour chart reveals that the Bitcoin (BTC) is currently trading below the 9-day and 21-day moving averages. BTC/USD is also trying to recover from the bearish momentum. However, the Bitcoin price may break above the 9-day and 21-day moving averages as it could hit the higher resistance at $58,500 and above.
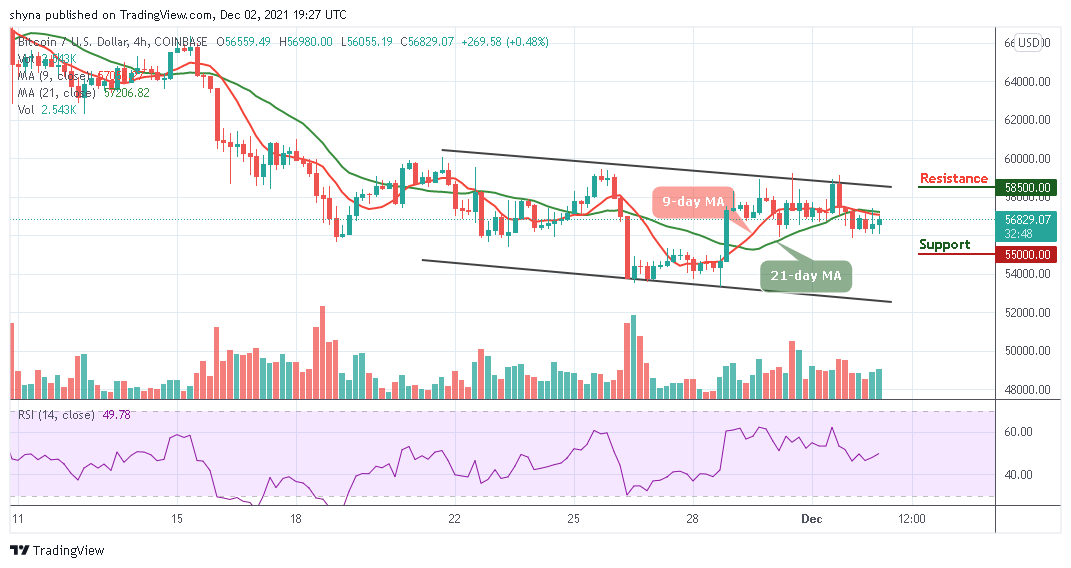
On the other hand, as the technical indicator Relative Strength Index (14) moves towards 50-level, if the bearish movement steps back, the support level of $56,000 may not be able to hold the selling pressure. More so, BTC/USD is likely to fall to $55,000 and below if the price slides toward the lower boundary of the channel.
Looking to buy or trade Bitcoin (BTC) now? Invest at eToro!
68% of retail investor accounts lose money when trading CFDs with this provider
Read more:


