

Bitcoin Price Prediction: BTC/USD Retraces Below $48,000

Bitcoin Price Prediction – August 26
Today, the Bitcoin price prediction is currently falling with close to $46,000 drop at the time of writing.
BTC/USD Long-term Trend: Ranging (Daily Chart)
Key levels:
Resistance Levels: $54,000, $56,000, $58,000
Support Levels: $42,000, $40,000, $38,000
At the time of writing, BTC/USD is hovering at $47,353 as there have been instances when BTC has already passed over this $47,000 level but sustaining the bearish price action is a downhill task. Presently, the path of least resistance is still downwards as the technical indicator reveals.
Bitcoin Price Prediction: Would Bitcoin Price Drop More?
Looking at the technical indicator, the Relative Strength Index (14) is crossing below 60-level but with the look of things, the Bitcoin price is not yet done with the downside. Despite the drop suffered a couple of days ago, the RSI (14) is likely to reach the 50-level and this could mean that there may still be a room that could be explored by the bears. Therefore, the Bitcoin price may follow the bearish movement if the 9-day MA crosses below the 21-day MA.
However, recovery may not come easy when looking from the upside but a sustainable move above the 9-day moving average may revisit the resistance level of $49,000, which may negate the bearish scenario and allow for an extended recovery above the upper boundary of the channel for the coin to move towards the potential resistance levels of $54,000, $56,000, and $58,000. Meanwhile, an increase in selling pressure may force the king coin towards the support levels of $42,000, $40,000, and $38,000.
BTC/USD Medium-Term Trend: Ranging (4H Chart)
On the 4-hour chart, the Bitcoin price is hovering below the 9-day and 21-day moving averages. BTC/USD has failed to survive the $47,500 support as the market continues the downside momentum. However, the first digital asset is likely to return to the bear market if the price breaks below the $lower boundary of the channel. Meanwhile, the critical support is located at $45,000 and below while the technical indicator Relative Strength Index (14) moves below 40-level.
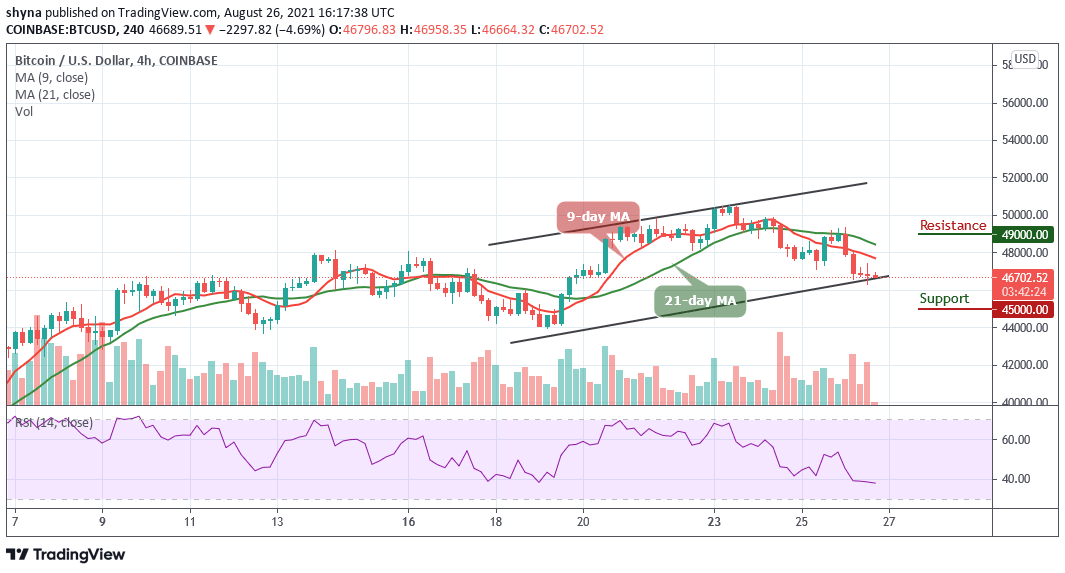
On the other hand, if the bullish movement steps back, the resistance level of $48,500 may come to play. More so, BTC/USD is likely to rise to $49,000 and above if the price cross above the 9-day and 21-day moving averages.
Looking to buy or trade Bitcoin (BTC) now? Invest at eToro!
75% of retail investor accounts lose money when trading CFDs with this provider


