

Bitcoin Price Prediction: BTC/USD Recovers from the Dip, Stays Above $53,000

Bitcoin (BTC) Price Prediction – March 26
The Bitcoin (BTC) is seen recovering from the dip and it is likely to move above the resistance level of $55,000.
BTC/USD Long-term Trend: Bullish (Daily Chart)
Key levels:
Resistance Levels: $58,000, $60,000, $62,000
Support Levels: $48,000, $46,000, $44,000
BTC/USD bulls begin to come into the market as the price remains below the 9-day and 21-day moving averages. At the time of writing, Bitcoin is seen gaining 3.9% to trade at $53,327. Meanwhile, despite correcting lower since the past few days, traders will be excited to see the king coin finally surpass the $55,000 psychological level.
Would Bitcoin Go Up or Down?
In the past 24 hours, the number-one crypto has been fluctuating between $53,900 and $51,200 levels. Technically, looking at the two levels, they may determine the next direction that BTC/USD will follow. In other words, the Bitcoin price may decline if the $51,000 support is broken while the price may rise if the $53,000 resistance is breached.
However, bears may take advantage to break the support of $50,000 if the bulls fail to keep the price above the upper boundary of the channel. Meanwhile, the technical indicator RSI (14) is seen moving to cross above the 48-level, indicating that an uptrend may come to play in the market. Moreover, the resistance levels could be found at $58,000, $60,000, and $62,000 while the supports lie at $48,000, $46,000, and $44,000 respectively.
BTC/USD Medium – Term Trend: Bearish (4H Chart)
According to the 4-hour chart, Bitcoin’s price is currently trading around $53,204 and within the 9-day and 21-day moving averages. Meanwhile, the bullish supply is coming up slowly into the market as the bears are also trying to drag the price down. More so, in as much as the buyers can strengthen the market, the Bitcoin price can hit a resistance level of $54,000.
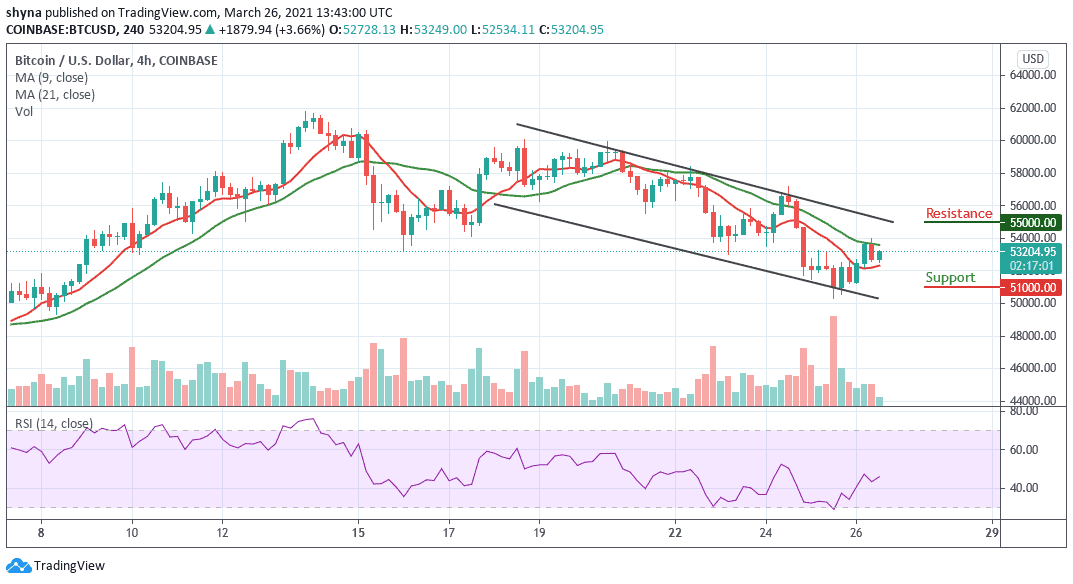
Furthermore, breaking above the $54,000 level could allow bulls to test the potential resistance at $55,000 and above. Meanwhile, the technical indicator RSI (14) is currently above the 45-level, but any bearish movement may welcome the sellers back into the market which could drag the price below the 9-day moving average to reach the support level of $51,000 and below.


