

Bitcoin Price Prediction: BTC/USD Recovers Above $62,000

Bitcoin Price Prediction – October 29
The Bitcoin price is currently trading above the 9-day moving average after the king coin recovers from $60,188.
BTC/USD Long-term Trend: Bullish (Daily Chart)
Key levels:
Resistance Levels: $68,000, $70,000, $72,000
Support Levels: $56,000, $54,000, $52,000
At the time of writing, BTC/USD is seen trading at $62,090 after soaring to $62,974 in the early hour of today’s trading. However, the first digital asset is also seen pulling back to where it is currently trading above the 9-day and 21-day moving averages which could head downwards if the bears step back into the market.
Bitcoin Price Prediction: Bitcoin Price May Reclaim $65k
On the bullish side, it is important for the Bitcoin price to stay above the 9-day and 21-day moving averages, otherwise, there may come a bearish breakdown when BTCUSD falls below that barrier. The 9-day MA still remains above the 21-day MA as the technical indicator RSI (14) is preparing to cross above 60-level where an oscillation to the higher boundary may confirm the proper trend which is more likely a bullish trend at the time of the outcome.
However, BTC/USD may confirm the bullish trend if the market price moves above the previous high of $65,000. Meanwhile, the Bitcoin price may follow the bearish trend if the price moves below the 21-day moving average and move towards the lower boundary of the channel. Should this happen, the king coin may drop to the critical supports of $56,000, $54,000, and $52,000. If the RSI (14) moves above 60-level, a strong bullish spike may push the price towards the resistance levels of $68,000, $70,000, and $72,000.
BTC/USD Medium-Term Trend: Bearish (4H Chart)
According to the 4-hour chart, BTC is looking bullish as the market is following a bullish trend. However, the intraday trading is still looking bullish following the recent rebound at $62,278 which is now a key support level. The next key support levels are $61,000 and below.
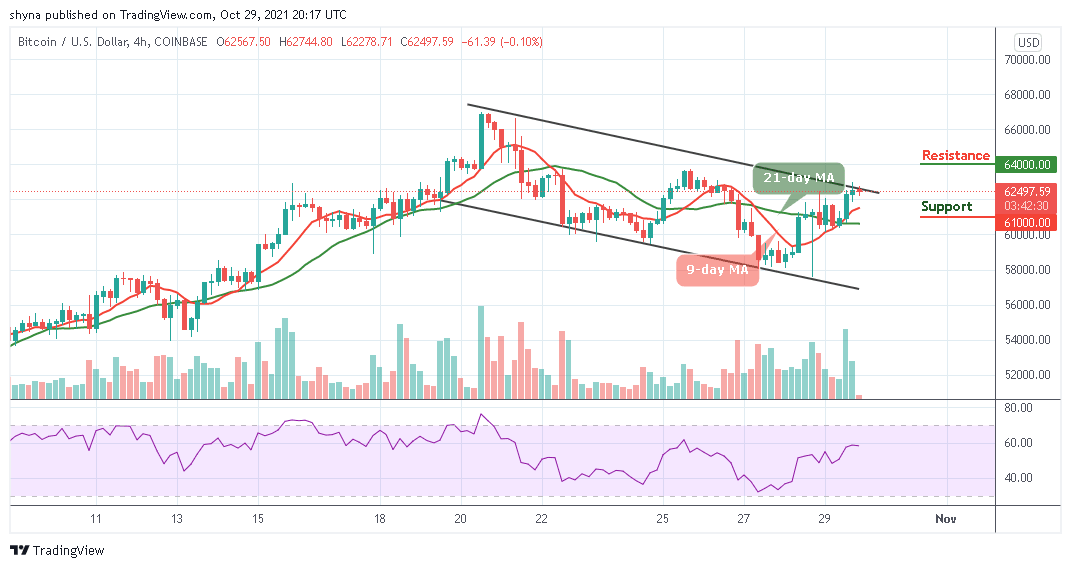
However, considering the recent sharp rebound, the Bitcoin price may continue the bullish rally to $63,000 resistance. A climb above this level may further push BTC price to the resistance level of $64,000 and above. As it looks now, bulls are returning into the market gradually as the technical indicator Relative Strength Index (14) moves above 60-level.
Looking to buy or trade Bitcoin (BTC) now? Invest at eToro!
68% of retail investor accounts lose money when trading CFDs with this provider
Read more:


