

Bitcoin Price Prediction: BTC/USD Recently Touches the Support of $46,000; Watch Out for the Next Move

Bitcoin (BTC) Price Prediction – March 2
After plummeting from $46,000 to $43,000, the Bitcoin price now manages to hold onto the critical support level of $46,000 once again.
BTC/USD Long-term Trend: Bullish (Daily Chart)
Key levels:
Resistance Levels: $55,000, $57,000, $59,000
Support Levels: $43,000, $41,000, $39,000
BTC/USD may undergo an aggressive bull run in the coming sessions, with their upside price targets lurking anywhere between the most important $60,000 and $65,000 resistance levels. However, Bitcoin typically pullbacks after testing the 21-day moving average to touch the line. Later, the cryptocurrency breaks bearish towards the 9-day moving average where we can call a support base before retracing its move upward to where it is currently trading at $48,780.
What to Expect from Bitcoin
The past few days were somewhat similar, as BTC/USD even dipped to $43,000 support. Meanwhile, since BTC/USD plummeted in value last week by more than $13,000 in a few days, the king coin is struggling to recover as it taps the $50,000 level again. However, the bulls are expected to start pushing the cryptocurrency towards the north. For this to come to focus, the 9-day MA must be able to cross above the 21-day MA.
However, if the market price moves above the moving averages, it may signal a jump towards $50,000, while breaking below the lower boundary of the channel may see Bitcoin drop to $45,000. Therefore, any bullish movement towards the north could locate the resistance levels at $55,000, $57,000, and $59,000 while the supports lie at $43,000, $41,000, and $39,000 as the technical indicator RSI (14) moves around 54-level.
BTC/USD Medium – Term Trend: Bearish (4H Chart)
Bitcoin’s price is now trading around $49,029 after rebounding from $48,342. Looking at the 4-hour price chart, we can see that the bullish supply coming up slowly in the market, but the bears are also trying to drag the price below the 9-day moving average. Meanwhile, the $46,000 support level and below may come into play if BTC breaks the moving averages.
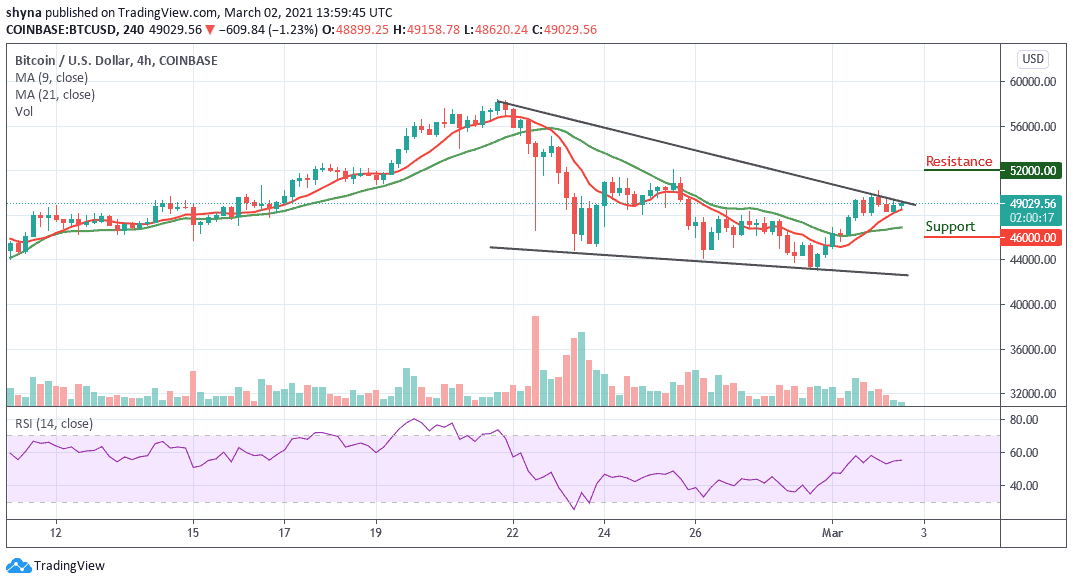
However, if buyers can strengthen and push the market price above the upper boundary of the channel, we can expect a retest of $50,000 resistance level. Therefore, breaking the mentioned resistance could also allow the bulls to test the $52,000, and above. However, BTC/USD is consolidating currently and moving sideways on the medium-term outlook as the RSI (14) moves in the same direction.


