

Bitcoin Price Prediction: BTC/USD Rally Towards $50,000 Resistance

Bitcoin Price Prediction – August 27
The Bitcoin price now manages to hold onto the critical support level of $46,361 as the coin touched the daily high of $48,572.
BTC/USD Long-term Trend: Ranging (Daily Chart)
Key levels:
Resistance Levels: $52,000, $54,000, $56,000
Support Levels: $43,000, $41,000, $39,000
BTC/USD may continue to experience a bull movement in the coming sessions as the coin moves to cross above the 9-day and 21-day moving averages. As the Bitcoin market opens today, the king coin retreats below the 9-day moving average to touch the daily low of $46,361. However, the cryptocurrency breaks bullish towards the 9-day moving average where we can call a support base before retracing its move upward to where it is currently trading at $48,350.
Bitcoin Price Prediction: Can Bitcoin Price Rally Above $50,000?
In the past 24 hours, the Bitcoin price has been fluctuating between $46,000 and $49,000 levels. Looking at the daily chart technically, these two levels may determine the next direction that the coin will follow. On the other hand, BTC/USD may decline if the $45,000 support is broken while the price may rise if the $50,000 resistance is breached.
Moreover, sellers may take advantage to break the support level of $46,000 should in case the bulls fail to keep the price above the 9-day and 21-day moving averages. Meanwhile, the technical indicator Relative Strength Index (14) is ready to cross the 60-level, indicating a bullish market movement. Moreover, should the Bitcoin price cross above the upper boundary of the channel, the resistance levels could be found at $52,000, $54,000, and $56,000 while the supports lie at $43,000, $41,000, and $39,000.
BTC/USD Medium – Term Trend: Ranging (4H Chart)
The Bitcoin price is seen trading around $48,413 resistance level according to the 4-hour chart. BTC/USD is hovering slightly above the 9-day and 21-day moving averages after a reversal from $46,361. Meanwhile, the 4-hour chart reveals that the bullish supply may come into the market slowly as the bears try to drag the price down. Therefore, if the buyers could energize the market, they can push the price to a $49,000 resistance level.
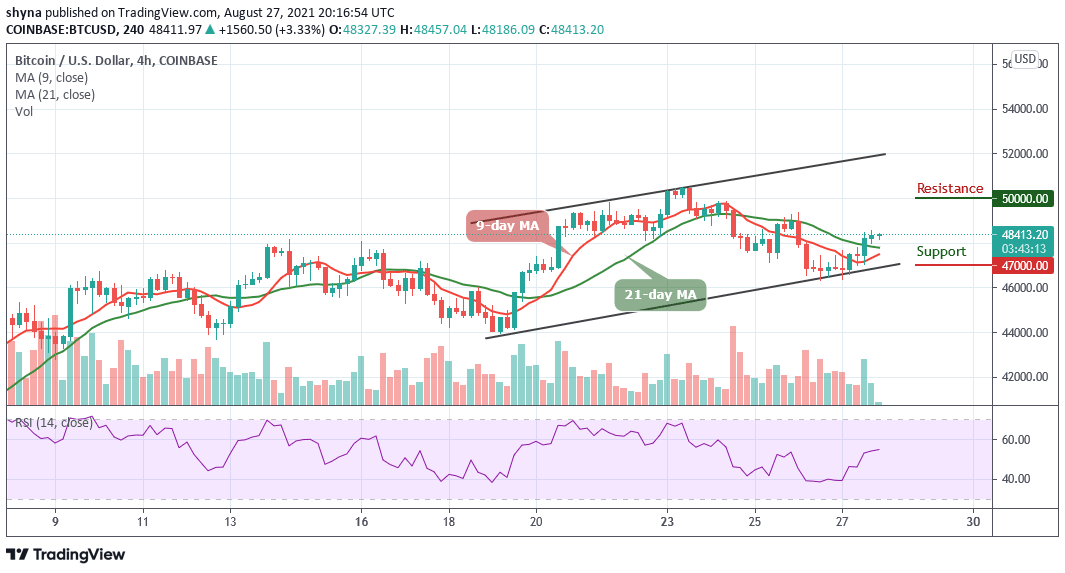
However, breaking the mentioned resistance could also allow the bulls to test the $50,000 and above. Meanwhile, the Relative Strength Index (14) is currently moving around 55-level, but any bearish movement below the lower boundary of the channel and may likely reach the support level of $47,000 and below.
Looking to buy or trade Bitcoin (BTC) now? Invest at eToro!
75% of retail investor accounts lose money when trading CFDs with this provider


