

Bitcoin Price Prediction: BTC/USD May Plunge to $51,000 If Price Breaks Below the Crucial Support Level

Bitcoin (BTC) Price Prediction – March 17
BTC/USD path of least resistance remains below the moving averages as the coin loses over $1,500.
BTC/USD Long-term Trend: Bullish (Daily Chart)
Key levels:
Resistance Levels: $62,000, $64,000, $66,000
Support Levels: $48,000, $46,000, $44,000
BTC/USD is down 2.72% in the last 24 hours but if the momentum revisits $56,000 resistance with support at $55,000, the Bitcoin price could go as high as $60,800. Since the past few days, BTC/USD has crashed with more than $4,000 hitting a low point of $54,138 before rebounding above $55,000 to trade at $55,381 at the time of writing.
What is the Next for Bitcoin?
if Bitcoin rejects the higher resistance level, lower levels may be tested in a sequence of lower highs and lower lows until prices touch the next critical support level. Therefore the market may experience a lot of short-term based trades and a lot of volatility too as the technical indicator RSI (14) moves below 60-level.
However, it is important to note that BTC/USD is most likely to break south if the 9-day MA crosses below the 21-day MA, and its failure to hold the mid-range support level may pull the price down to its next support level at $52,000. Meanwhile, the short-term analysis indicates that BTC/USD may test higher levels with key resistance at $61,500 before a reversal and the resistance levels to watch are $62,000, $64,000, and $66,000 while the supports are located at $48,000, $46,000, and $44,000 respectively.
BTC/USD Medium – Term Trend: Bullish (4H Chart)
According to the 4-hour chart, BTC/USD has been facing immense turbulence throughout the past several days, with sellers forcing its price down to the lows of $54,138. If bulls decide to push the market price above the moving averages, the coin may likely hit the resistance at $60,000 and above.
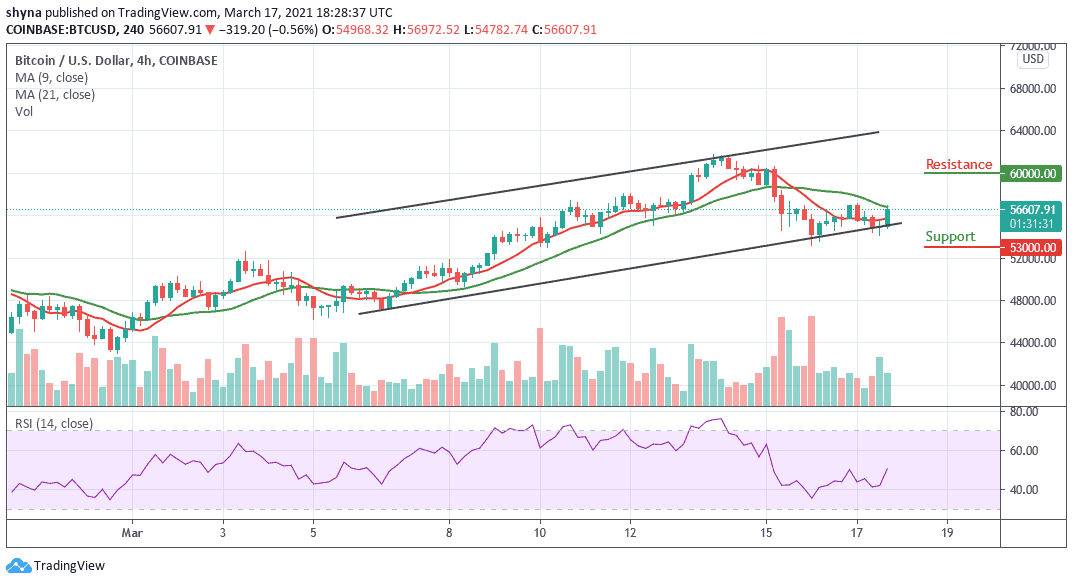
However, it now appears that the cryptocurrency is now ready for further upside in the near-term, as the multiple attempts to shatter its $60,000 resistance seem to indicate that bears are building momentum. As the RSI (14) moves towards the north, any reversal may locate the critical supports at $53,000 and below.


