

Bitcoin Price Prediction: BTC/USD Market Now Again Attempts to Trade past the Value of $60,000 Resistance

Bitcoin Price Prediction – March 19
The BTC/USD trade has been on a slight recovery moving manner after a recent small drop from a high of $60,000 point. The crypto’s price now trades approaching the high value once again.
BTC/USD Market
Key Levels:
Resistance levels: $65,000, $70,000, $75,000,
Support levels: $50,000, $45,000, $40,000
BTC/USD – Daily Chart
In the last few trading days’ sessions, there has been a featuring of bullish and bearish candlesticks around $60,000 and $55,000 levels. The bullish trend-line and the 14-day SMA trading indicator are now placed to determine the vital support point at which price is expected to come with a more distinct action. The 50-day SMA trend-line is under the smaller SMA indicator pointing towards the north. The stochastic Oscillators are trying to cross the hairs closer above range 40. That signifies an expectation backing a return of an upward market move sooner than later.
Will BTC/USD market still find it tough breaching past the $60,000 resistance line?
It appears that there has been a kind of consolidation price moves ongoing in the market valuation of BTC/USD. As a result, bulls will have this time around putting more efforts in their energy to come with a full bullish-candlestick body formation against the main resistance of $60,000 to create a better stride for the continuation of an upward trend in this crypto-currency pair trading operations.
As regards the downward moves of this crypto-economy, bears will have to most of the time be on the lookout for a reversal formation set-up after price might have gotten to a peak level during a volatile move. A variant price rejection around the point of $60,000 may potentially result in letting the crypto-trade witness a line of range-bound movements. Meanwhile, the maximum that bears may push to the south is not expected beyond the support of the $50,000 level in a near-critical sell-off scenario.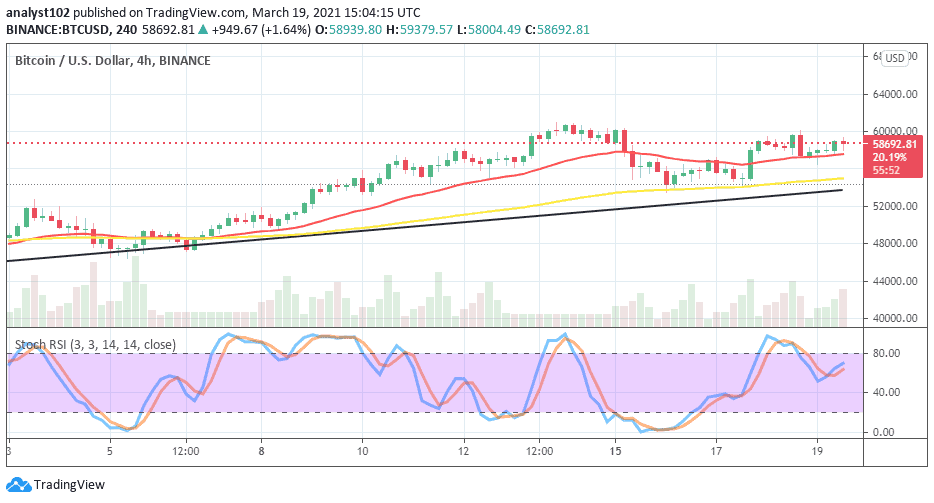
BTC/USD 4-hour Chart
Despite a decline in the trading line of BTC/USD, the trend outlook still appears to be bullish on the 4-hour trading chart. It shows that the smaller SMA had once been breached to the south to find support at the bigger SMA trading indicator located below. Japanese candlesticks are now featuring closer on the buy signal side of the 14-day SMA to indicate that bulls are still in control of this market to some extent. The stochastic Oscillators now briefly point to the north near below range 80. This crypto-market needs a 4-hour candlestick for a spike against the key $60,000 resistance line to decently project a bullish trend continuation.


