Bitcoin Price Prediction: BTC/USD Market Dips past Below the Key Point of $60,000

Bitcoin Price Prediction – April 18
In the recent sessions, the trade worth of BTC/USD was trading between the points of $65,000 and $60,000. But, as of now, the crypto’s value has succumbed to a degree of pressure inflicted on it by the US Dollar in the market.
BTC/USD Market
Key Levels:
Resistance levels: $60,000, $65,000, $70,000,
Support levels: $50,000, $45,000, $40,000
BTC/USD – Daily Chart
Today’s ongoing formation of a bearish candlestick has engulfed several featuring of bullish candlesticks that saw BTC’s point initially to the peak trading zone of $65,000. That signifies a start in the return of a downward move in the crypto-trade. The lower bullish channel-line and the 14-day SMA trend-line have been breached to the south. Like wisely, the Stochastic Oscillators have crossed southbound from the overbought region to point towards the south around range 40. That indicates ongoing selling pressures in the BTC/USD trading activities presently.
Will the BTC/USD bears hold further stronger beyond the $55,000 level?
The present trading situation has shown a line of weaknesses in the capacity of the BTC/USD bulls to lay a stronghold during a short-lived range-bound trading time between the points of $60,000 and $65000. However, from the look of things, the present downward move is tending to create a correction in the crypto’s worth to find support to station an up-stride. And, the value at $50,000 still stands as a vital line that the bulls may have to wait for if the correctional move will be extended afterward.
Taking the further downward moves of this market into consideration, bears need to capitalize on the current selling forces to push below the support of $55,000. In that way, more of the next trading days’ sessions will most likely witness variant degrees of sell-offs. Being as it is now, the critical support has shifted to the earlier mentioned price line. Therefore, it can as well be difficult for bears to sustainably push down price below it in no time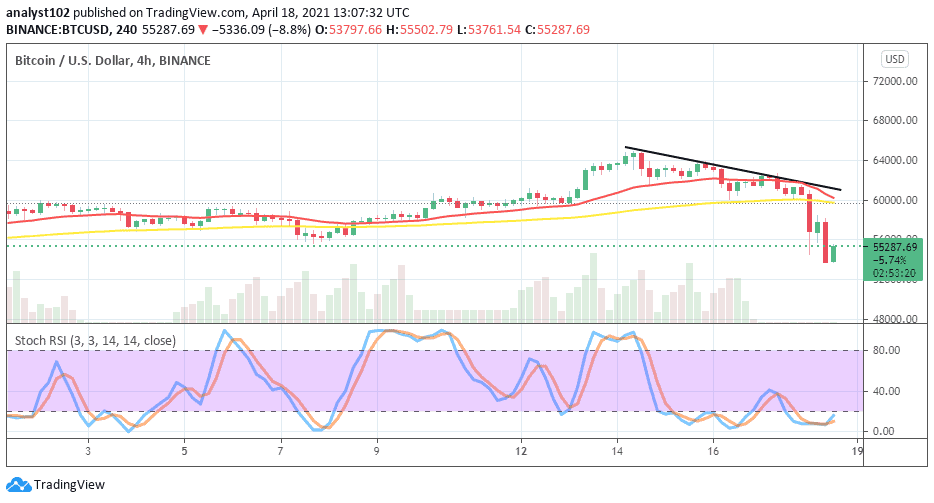
BTC/USD 4-hour Chart
It has been established that the medium-term run of the BTC/USD market is now under visible selling pressure. The 14-day SMA trend-line has bent to the south in an attempt to cross the 50-day SMA indicator from the top to affirm a downward pressure trading position of the market. The Stochastic Oscillators are dipped into the oversold region to move in a consolidation manner. That still indicates the presence of bears in the market. The crypto’s still showing a sign of regaining the momentum in the medium-term trading outlook. But, it may take a while to fully achieve just that.