

Bitcoin Price Prediction: BTC/USD Lacks Technical Breakdown as the Price Plummets Under $57,000

Bitcoin (BTC) Price Prediction – March 22
BTC/USD is currently in the hands of the sellers but consolidation is likely between $56,000 and $59,000.
BTC/USD Long-term Trend: Bullish (Daily Chart)
Key levels:
Resistance Levels: $62,000, $64,000, $66,000
Support Levels: $52,000, $50,000, $48,000
A couple of days ago, BTC/USD turned heads with its majestic rise to highs above the potential $57,000 level. In fact, the number-one crypto extended its gains above $57,500. In addition, the Bitcoin price did not stay up for long because of an immediate reversal. In the early hours of yesterday, BTC/USD held on to the support above $56,000 but unfortunately, the tables were turned during the European session as Bitcoin tanked to $55,543.
Where is BTC Price Going Next?
At the time of writing, BTC/USD is trading at $56,988 with a loss of 0.64% on the day. The trading is likely to face a downtrend as the technical indicator RSI (14) moves below 60-level. It is important that the bulls reclaim the position above $58,000 as this would allow them to focus on higher levels towards $60,000. On the other side, continued declines under the short-term support at $56,500 could easily open the way to the south.
Meanwhile, the breakdown towards $55,000 is not out of the picture because the losses in the last 24 hours show that BTC/USD was not technically ready for the breakout above $60,000. Looking at the daily chart, BTC/USD is making an attempt to regain ground by moving the market price to the next level but any bullish movement above the moving averages may push the price to the resistance level of $62,000, $64,000, and $66,000 while the supports lie at $52,000, $50,000, and $48,000 respectively.
BTC/USD Medium – Term Trend: Ranging (4H Chart)
According to the 4-hour chart, the Bitcoin price first went up but has dropped within 24 hours. If the price continues to drop further and move below the channel, it could reach the nearest support levels at $54,000 and below.
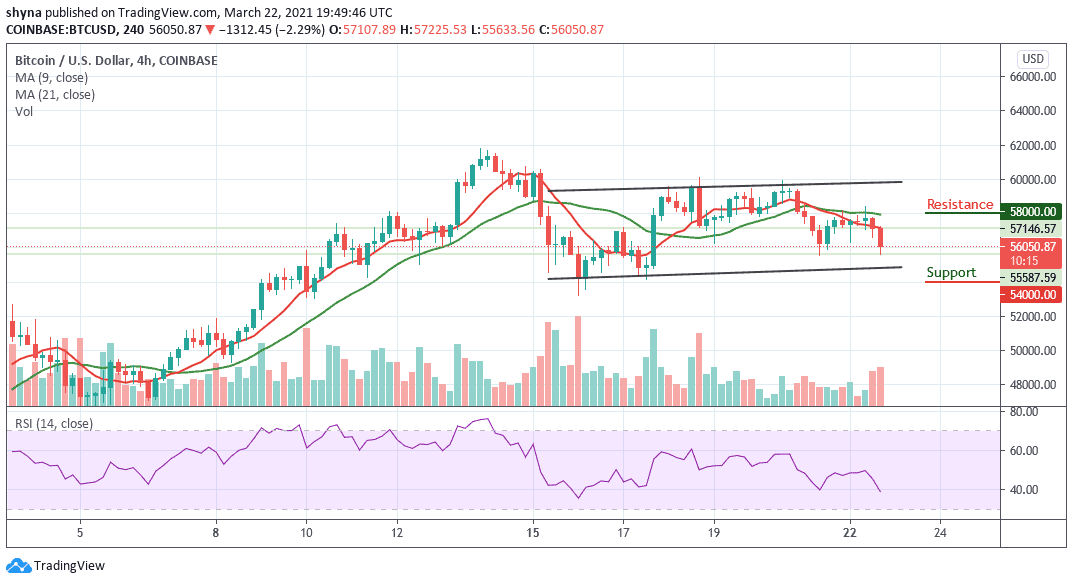
Moreover, if the bulls push the coin above the 9-day and 21-day moving averages, the price of Bitcoin may likely reach the potential resistance levels of $58,000 and above. Presently, the market is down as the RSI (14) indicator moves below the 40-level.


