

Bitcoin Price Prediction: BTC/USD Gains Above $50,000; Fresh Rally Ahead?

Bitcoin (BTC) Price Prediction – March 8
Yesterday, the Bitcoin (BTC) price surged to $51,000 as the coin begins to show signs of a fresh rally.
BTC/USD Long-term Trend: Bullish (Daily Chart)
Key levels:
Resistance Levels: $57,000, $59,000, $61,000
Support Levels: $45,000, $43,000, $41,000
Due to the heavy selling pressure that occurs today, BTC/USD falls to as low as $49,328, only to pare some of its intraday losses as bulls started coming into the market. At the time of writing, Bitcoin is seen gaining 1.61% to trade at $51,800. Meanwhile, despite correcting lower from the weekend highs above $51,459, traders will be excited to see the king coin finally surpass the $50,000 psychological level.
Would Bitcoin Go Up or Down?
In the past 24 hours, the number-one crypto has been fluctuating between $49,500 and $52,000 levels. Looking at the daily chart technically, these two levels will determine the next direction that the coin will follow. On the other hand, BTC/USD may decline if the $48,000 support is broken while the price may rise if the $52,000 resistance is breached.
However, bears may take advantage to break the support of $49,500 if the bulls fail to keep the price above the 9-day and 21-day moving averages. Meanwhile, the technical indicator RSI (14) keeps moving in the same direction below the 60-level, indicating that an indecisive in the market movement. The resistance levels could be found at $57,000, $59,000, and $61,000 while the supports lie at $45,000, $43,000, and $41,000 respectively.
BTC/USD Medium – Term Trend: Bullish (4H Chart)
According to the 4-hour chart, Bitcoin’s price is currently trading around $51,665 and above the 9-day and 21-day moving averages after a reversal from $45,328. Meanwhile, we can see that the bullish supply is coming up into the market while the bears are also trying to drag the price down. However, if the buyers could strengthen and energize the market, they can further push the price to a $53,000 resistance level.
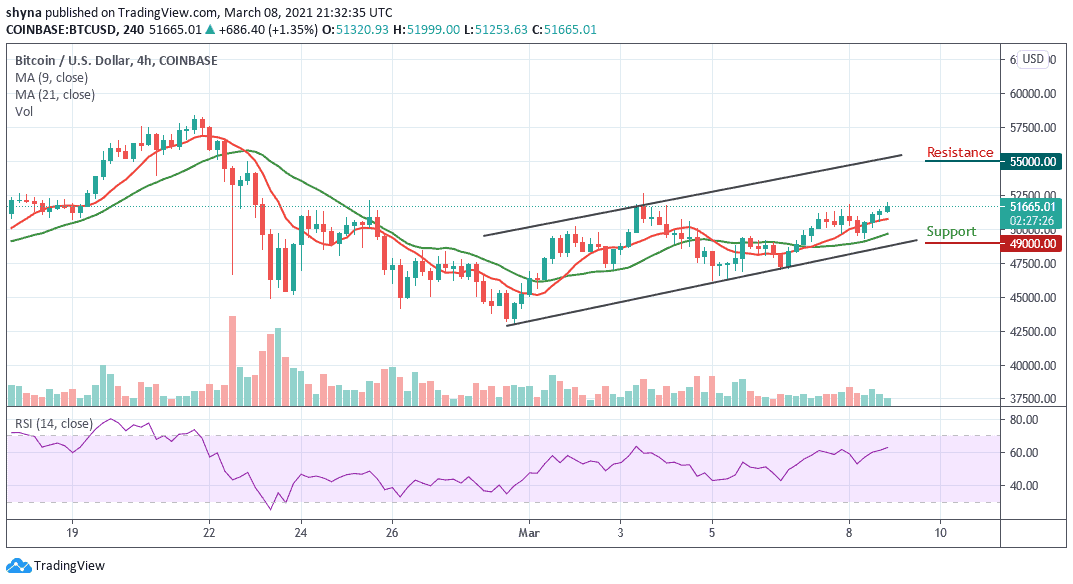
Therefore, breaking the mentioned resistance could also allow the bulls to test the $55,000 and above. Meanwhile, the RSI (14) is currently above the 60-level, but any bearish movement may welcome the sellers back into the market which could drag the price below the moving averages, which may likely reach the support level of $49,000 and below.


