

Bitcoin Price Prediction: BTC/USD Finds New Support near $50,000, as the $60,000 Remains a Major Resistance Line

Bitcoin Price Prediction – March 28
The flagship crypto’s value as placed base with the US Dollar has been suffering from a sustainable up-surging past the key resistance point of $60,000 over time.
BTC/USD Market
Key Levels:
Resistance levels: $60,000, $65,000, $70,000
Support levels: $50,000, $45,000, $40,000
BTC/USD – Daily Chart
On March 14 trading session, a small bearish candlestick occurred to signal a start of reversal moves against the resistance line of $60,000 that eventually led BTC’s value located another support level closer to the $50,000 level. March 26 trading candlestick emerged bullish from the said support level against the 14-day SMA trend-line to set the crypto’s point on another journey to the north. All the trend-lines yet point towards the north as the 14-day SMA is above the 50-day SMA. The Stochastic Oscillators have crossed the hairs from the oversold region to point towards the north at range 40. That showcases the potential of seeing the crypto’s value getting back to its bullish moves.
Will there soon be another reversal moves in the BTC/USD value?
Having had a formation of a bullish candlestick bottoming near the support of $50,000 level, it appears that the BTC/USD bulls are embarked on putting more required pushing efforts to the north direction this time around. That said, the main resistance trading line is still around the level of $60,000. As a result, more buying pressures need to put up around that line for a healthy stride keep.
As regards the BTC/USD market’s downturn, it would still be a good technical trading approach for bears to be on the lookout while price faces a line of rejections around the resistance level of $65,000 or, better still around the key resistance of $60,000 as initially witnessed during the previous bullish reversal moves. A breakdown of the immediate support level of $50,000 isn’t in a near focus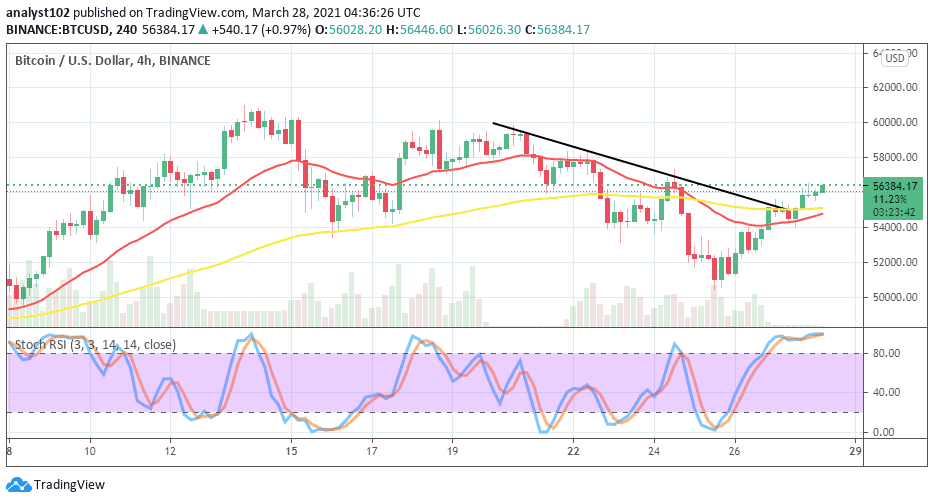
BTC/USD 4-hour Chart
The BTC/USD 4-hour trading chart has shown that the crypto’s worth has begun to recover from a drop as all the indicators have been traded past to the north. The 50-day SMA trend-line is a bit over the 14-day SMA indicator. The smaller SMA now points toward the north near below the bigger SMA. The Stochastic Oscillators have penetrated the overbought region to join the hairs together within it. That signifies an ongoing consolidation move at a higher level in the BTC/USD trading operations. A long less-active at this point may again cause the crypto to lose momentum in the long run.


