Bitcoin Price Prediction: BTC/USD Finally Recovers Above $50,000

Bitcoin Price Prediction – December 12
The Bitcoin price is currently trading above the 9-day moving average after the first digital asset recovers from $48,665.
BTC/USD Long-term Trend: Bearish (Daily Chart)
Key levels:
Resistance Levels: $55,000, $57,000, $59,000
Support Levels: $45,000, $43,000, $41,000
BTC/USD is currently holding above $50,000 resistance level as the coin prepares for another push higher. Looking at the daily chart, the Bitcoin price is now pushing the coin above the 9-day moving average but may struggle to gain momentum as the entire market’s uptrend stalls.
Bitcoin Price Prediction: Bitcoin Price May Face the Upside
The Bitcoin price is currently trading at $50,219 with a gain of 1.64% on the day. The trading is likely to cross above the 21-day moving average as the technical indicator Relative Strength Index (14) prepares to cross above 40-level. It is important that the bulls reclaim this barrier as this would allow them to focus on higher levels towards $52,000. On the other side, any declines below the 9-day moving average could easily open the way to the south.
However, the breakdown below $48,000 is not out of the picture because the losses in the last few days show that BTC/USD may not be technically ready for the breakout above $52,000. Looking at the daily chart, Bitcoin (BTC) is likely to regain ground by moving the market price to the next level. Moreover, any bullish movement above the 21-day moving average may push the price to the resistance levels of $55,000, $57,000, and $59,000 while the supports are located at $45,000, $43,000, and $41,000 respectively.
BTC/USD Medium – Term Trend: Ranging (4H Chart)
Looking at the 4-hour chart, the Bitcoin price remains above the 9-day and 21-day moving averages as the coin move towards the upper boundary of the channel. Therefore, if the price continues to rise further, it could reach the potential resistance levels at $52,000, $54,000, and $56,000 respectively.
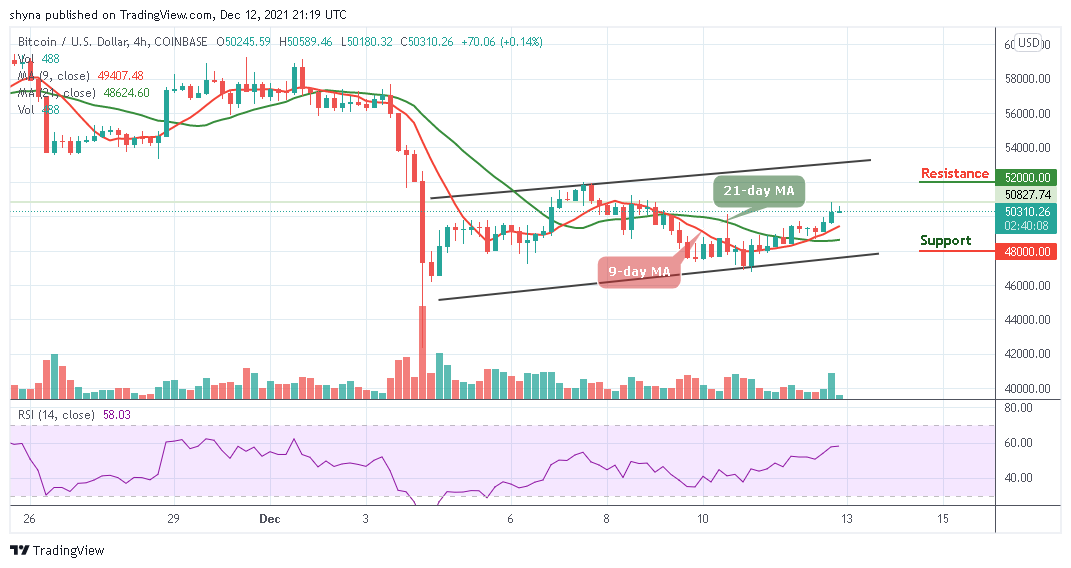
Moreover, if the bears push the coin below the 9-day and 21-day moving averages; it may likely hit the closest supports at $48,000, $46,000, and $44,000. Presently, the technical indicator Relative Strength Index (14) is likely to cross above 60-level to confirm the bullish trend for the market.
Looking to buy or trade Bitcoin (BTC) now? Invest at eToro!
68% of retail investor accounts lose money when trading CFDs with this provider
Read more: