

Bitcoin Price Prediction: BTC/USD Fails at $60,000, Price Drops Below $57,000 Support

Bitcoin (BTC) Price Prediction – March 21
After a few days of flirting with the $60,000 line, BTC/USD fails at breaching the milestone as the price drops below $57,000 support.
BTC/USD Long-term Trend: Bullish (Daily Chart)
Key levels:
Resistance Levels: $60,000, $58,000, $56,000
Support Levels: $54,000, $52,000, $50,000
For the past few days, BTC/USD remained relatively stagnant, just beneath the $60,000 price tag as king coin even attempted a few breakouts above that psychological level but to no avail. However, the latest rejection came just hours ago and this failure drove the first digital asset vigorously south as it lost about $3,000 of value to an intraday low of beneath $57,000.
What to Expect from Bitcoin (BTC)
As BTC/USD fails to settle above the resistance level of $60,000, it is likely for the coin to start a strong decline if there is a close below the $55,000 support. Meanwhile, if the price remains stable above the $57,000 level, there are chances of a fresh increase in the near term and an initial resistance on the upside is around the $59,000 level while the main resistance remains around the $60,000 level.
However, a clear break above the $60,000 zone might open the doors for a strong increase in the next positive direction. Therefore, in the stated case, the price could rise towards the resistance levels of $64,000, $66,000, and $68,000. On the other hand, the RSI (14) is seen adjusting to the south and any bearish movement below 50-level could see the price reaching the critical supports at $52,000, $50,000, and $48,000 respectively.
BTC/USD Medium – Term Trend: Ranging (4H Chart)
At the opening of the market today, the Bitcoin price first went up but has dropped slightly within 24 hours, bringing its price from $58,651 to touch the low of $55,543. Should the price continue to drop further and move below the channel, it could reach the nearest supports at $54,000, $52,000, and $50,000 respectively.
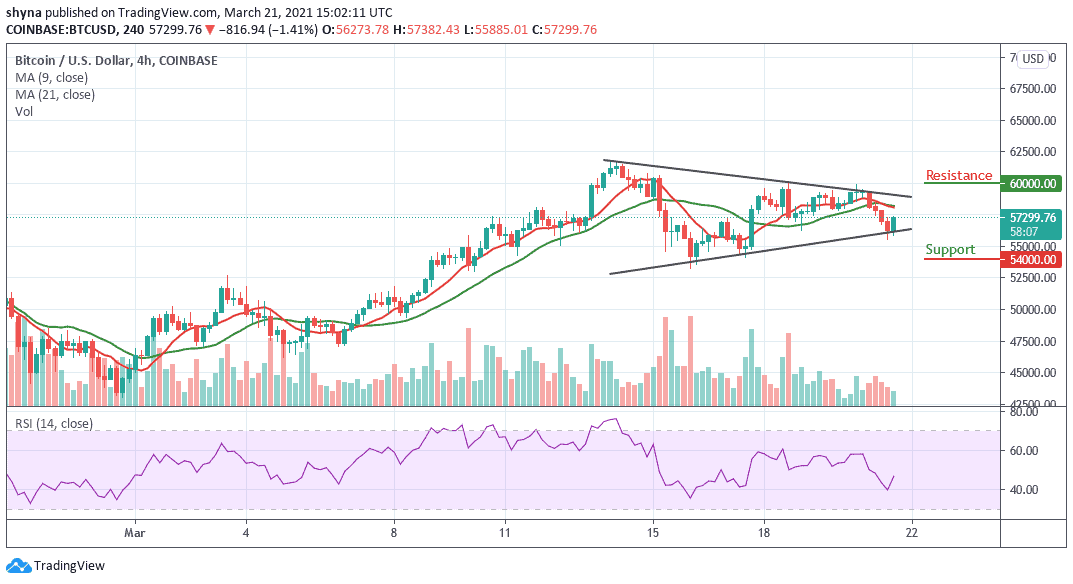
However, if bulls push the coin above the 9-day and 21-day moving averages, the price of Bitcoin may likely reach the potential resistance levels of $60,000, $62,000, and $64,000 as the RSI (14) indicator moves above 45-level.


