Bitcoin Price Prediction: BTC/USD Drops Sharply Below $35,000

Bitcoin Price Prediction – June 21
The Bitcoin price is recovering from the recent low of $31,700 but bulls may have trouble taking the market price above $38,000.
BTC/USD Long-term Trend: Bearish (Daily Chart)
Key levels:
Resistance Levels: $43,000, $45,000, $47,000
Support Levels: $26,000, $24,000, $22,000
At the time of writing, BTC/USD is trading down by 9.28% at its current price of $32,285. This is the same spot where the coin has been trading for the past few days, with the selling pressure seen in the $31,030 region proving significant. Moreover, where the king coin may go next could depend on whether or not bulls can take control of it before it breaks below $30,000 or $28,000.
Bitcoin Price Prediction: Any Hope to Trade Higher?
On the upside, the Bitcoin price is likely to face sellers near the $30,000 zone. However, a clear close below the $28,000 resistance could most likely start a strong selling pressure. Meanwhile, the next target for the bulls could be above the 9-day and 21-day moving averages at $40,000 in the near term. Any more gains could lead the price towards the $43,000, $45,000, and #47,000 resistance levels.
Moreover, if the Bitcoin price fails to clear the $33,000 resistance, it could correct lower. The first key support is located around the $32,000 level. The main support is near the trend line and $28,000. Any more losses might call for a test of the $26,000 support level. If the bulls fail to defend the $24,000 support zone, the price is likely to dive towards the $22,000 support in the coming sessions as the technical indicator Relative Strength Index (14) crosses below 38-level, suggesting more bearish signals.
BTC/USD Medium-Term Trend: Ranging (4H Chart)
On the 4-Hour chart, the Bitcoin price hovers around $32,423 and may take time to persistently trade above $35,000. More so, if the bulls gather enough strength and regroup, the upward movement may be able to near the $36,000 and $38,000 resistance levels.
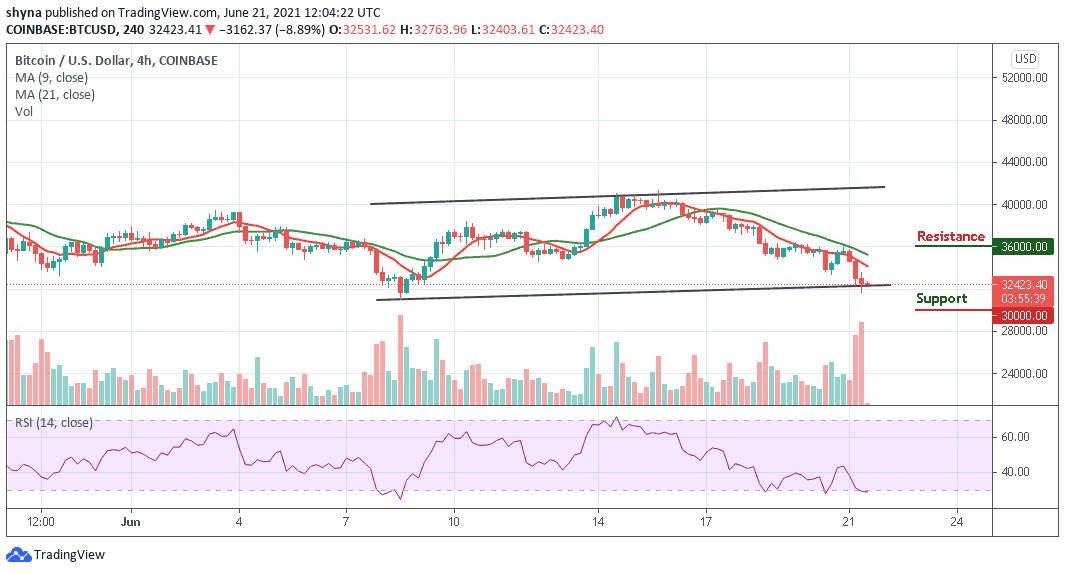
On the downside, immediate support is below the lower boundary of the channel as the main support is at the $31,000 level. However, the Bitcoin price may likely fall below $30,000 if the bears step back into the market, a further movement could test the critical support at the $28,000 level. Technically, the Bitcoin price is currently moving in sideways as the technical indicator Relative Strength Index (14) moves below the 30-level, indicating an indecisive market movement.
Looking to buy or trade Bitcoin (BTC) now? Invest at eToro!
75% of retail investor accounts lose money when trading CFDs with this provider