

Bitcoin Price Prediction: BTC/USD Drops Below $49,000 Again

Bitcoin Price Prediction – August 29
The Bitcoin price drops today from a high of $49,667 to a low of $47,801 within a few hours that the market opens.
BTC/USD Long-term Trend: Bullish (Daily Chart)
Key levels:
Resistance Levels: $54,000, $56,000, $58,000
Support Levels: $44,000, $42,000, $40,000
BTC/USD is in the middle of a bearish move as the downward momentum is now becoming quite unstoppable while the key support at $47,000 has been ravaged, forcing the bulls to concentrate on defending the next support which is targeted at $45,000. If this is broken, additional supports may be found at $44,000, $42,000, and $40,000.
Bitcoin Price Prediction: Bitcoin (BTC) May Retreats
As seen in the daily chart, the Bitcoin price is crossing below the 9-day moving average after touching the daily high of $49,667. Meanwhile, the formation of a bullish flag pattern suggests that the upside action could continue only if the pattern’s support is not broken. However, the technical indicator has also supported the bearish motion, further drumming home the idea that this could be the end of the bull’s rally.
Furthermore, the Relative Strength Index (14) is seen crossing below 60-level as the sharp downward slope is a clear indication of the influence which may allow the bears to put more pressure on the market and a reversal is possible but only if the resistance at $50,000 is reclaimed. However, the persistence trade above this level may technically push the coin to the resistance levels of $54,000, $56,000, and $58,000.
BTC/USD Medium – Term Trend: Ranging (4H Chart)
Looking at the 4-Hour chart, Bitcoin (BTC) has not yet slipped below $45,000 and it is still in the loop of making a bounce back. Meanwhile, the Bitcoin price is hovering below the 9-day moving average and the king coin may likely take time to trade above the $49,000. At the moment, the Bitcoin price is currently moving around the $48,305 level.
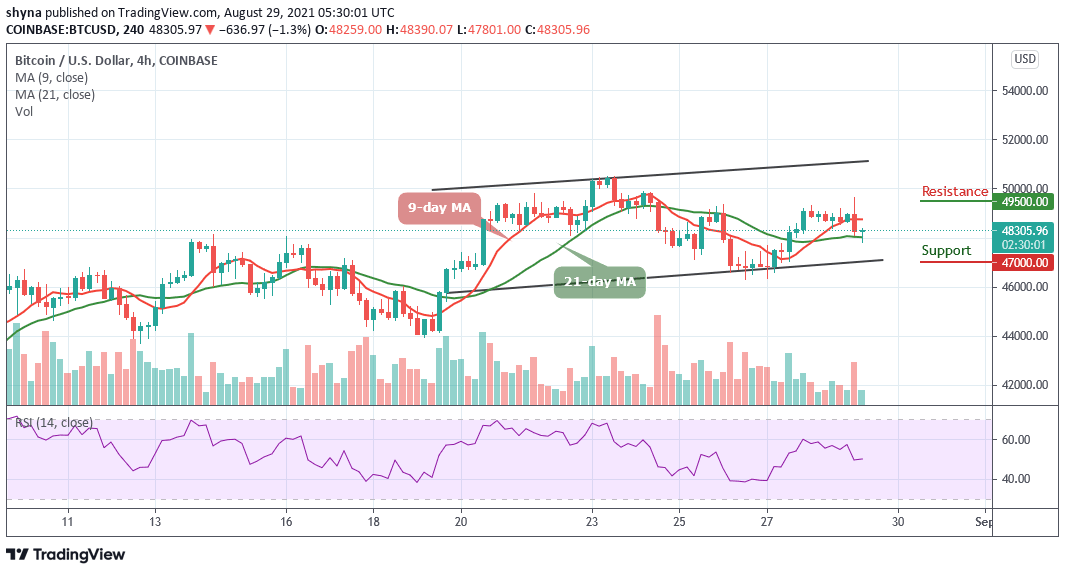
However, if the bulls can regroup and energize the market, traders may expect a retest of $48,800 level. Therefore, breaking the $49,000 could also allow the bulls to move above the 9-day moving average to test the resistance levels of $49,500 and above. In other words, if the bears should continue to hold the price and drag it downward, then the support levels of $47,000 and below may be visited as the Relative Strength Index (14) moves around 50-level, indicating a sideways movement.
Looking to buy or trade Bitcoin (BTC) now? Invest at eToro!
75% of retail investor accounts lose money when trading CFDs with this provider


