

Bitcoin Price Prediction: BTC/USD Could Reach $65,000 Level; Dips Likely to be Limited

Bitcoin (BTC) Price Prediction – March 14
After touching the daily high of $61,680, the Bitcoin price begins a downside correction.
BTC/USD Long-term Trend: Bullish (Daily Chart)
Key levels:
Resistance Levels: $66,000, $68,000, $70,000
Support Levels: $54,000, $52,000, $50,000
At the time of writing, BTC/USD is seen slipping below the $61,000 level as buying pressure cooled off. The market price is now hovering around $60,094.55 to form a low at near $59,401 before stabilizing. As of now, BTCUSD stays above the 9-day and 21-day moving averages but it is down by 1.77%.
What to Expect from Bitcoin (BTC)
BTC/USD is presently correcting lower for the past few hours. A decisive breakout below $59,000 support may intensify selling pressure. Therefore, if bears push the market price downwards, the consolidation may turn into a bear-run. More so, the sideways movement is likely to play out for the next few days and the next hurdle for the king coin could emerge at $62,000, but it won’t stop the higher price movements.
However, bulls need massive liquidity and volume to cross the $61,000 highs and make a dash to the $62,000 level. The technical indicator RSI (14) is seen moving below the 75-level within the overbought zone as the sharp downward slope is a clear indication of the influence which may allow bears to increase the pressure.
Meanwhile, a reversal is possible but only if the resistance at $61,000 is reclaimed. The persistence trade above this level may technically push the coin to the resistance levels of $66,000, $68,000, and $70,000 while the supports lie at $54,000, $52,000, and $50,000.
BTC/USD Medium – Term Trend: Bullish (4H Chart)
Looking at the 4-Hour chart, Bitcoin (BTC) has not yet slipped below $59,000 but in the loop of making a bounce back. The Bitcoin price hovers within the 9-day moving average and may likely take time to trade above the $62,000. At the moment, the Bitcoin price is currently moving around $60,104 level.
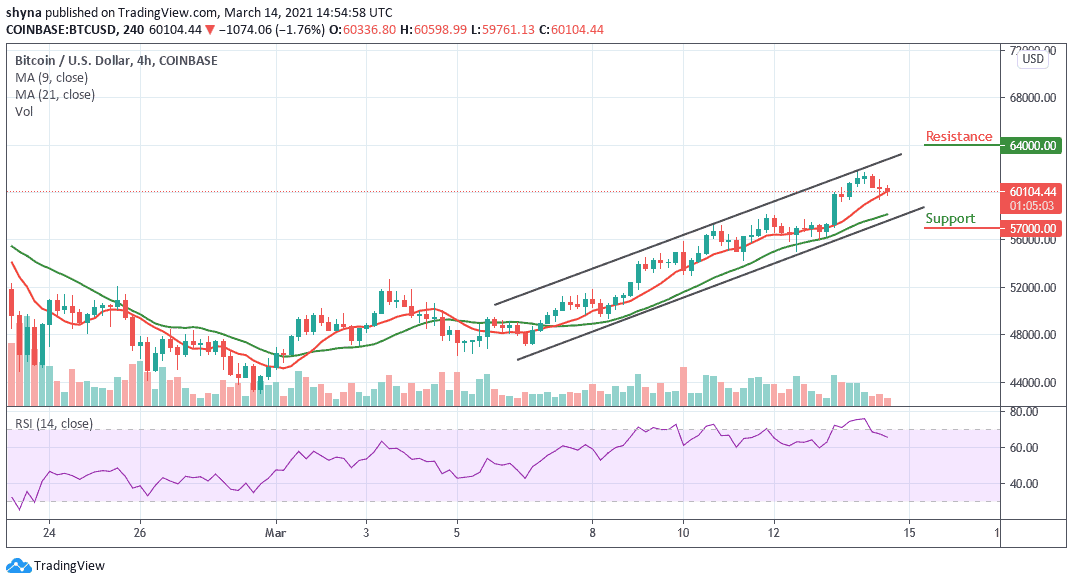
However, if the bulls energize the market, the price may likely test the resistance levels of $64,000 and above. In other words, if the bears should continue to hold the price and drag it downward, then the support levels of $57,000 and below may be visited as the RSI (14) moves below 65-level, indicating additional bearish movement.


