

Bitcoin Price Prediction: BTC/USD Breaks below $53,000 Level; Price Could Revisit $45,000 Support

Bitcoin (BTC) Price Prediction – March 25
The Bitcoin bulls prepare for a shock as the technical indicator getting ready to send the first digital asset to $45,000.
BTC/USD Long-term Trend: Bullish (Daily Chart)
Key levels:
Resistance Levels: $57,000, $59,000, $61,000
Support Levels: $45,000, $43,000, $41,000
BTC/USD is seen falling towards $50,000 once again as the largest cryptocurrency embarked on a support smashing exercise after failing to hold above $53,000 following a significant breakout in the last few days. The bearish control is widespread across the market with other major digital assets posting similar losses as they trade below the 9-day and 21-day moving averages.
What is the Next Direction for Bitcoin?
At the time of writing, BTC/USD is recovering above $51,000 from the daily low of $50,305. However, if bulls increase their entries, they might likely create more volume, in turn, pushing the market price above the next key levels at $54,000 and $56,000. It is now clear that $57,000 is the most critical level in Bitcoin’s recovery journey. Therefore, the further bullish movement may reach other resistance levels at $59,000 and $61,000.
According to the technical indicator RSI (14), BTC/USD is still in an area with intense support as the signal line crosses below 45-level. This explains the immediate reversal above $51,050. On the other hand, a breakdown under the pattern’s support is likely to encourage more selling entries which may likely pull the BTC/USD massively below $50,000. However, losses below the moving averages could signal more retracement to levels closer to $45,000, $43,000, and $41,000 supports.
BTC/USD Medium-Term Trend: Bearish (4H Chart)
On the 4-Hour chart, the Bitcoin price stays below the 9-day and 21-day moving averages and the immediate support is below the moving averages at the $51,000 level. The price may likely fall below $50,000 if the bears fully stepped back into the market.
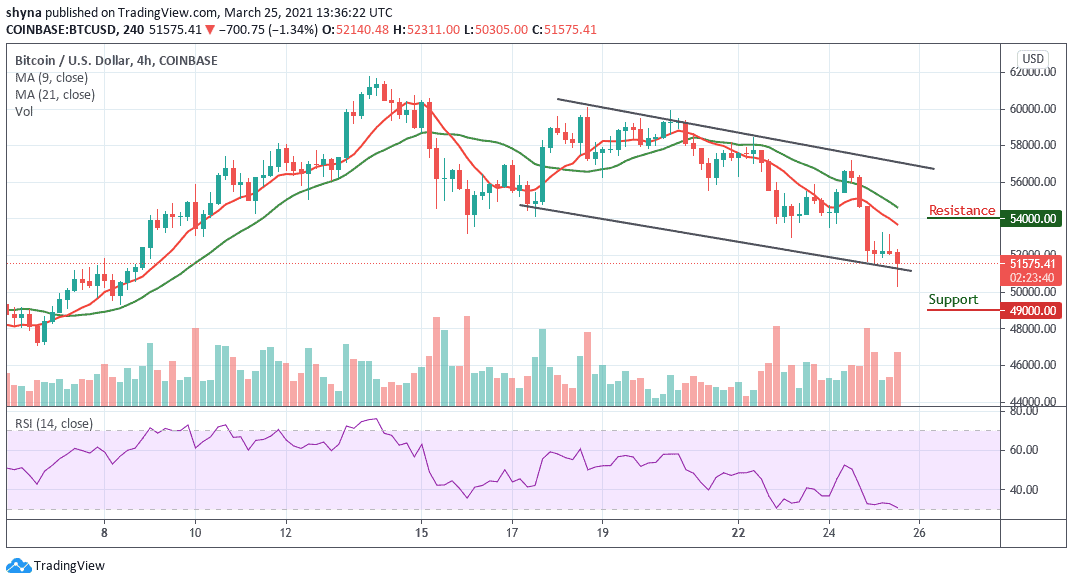
However, a further bearish movement could test the critical support at the $49,000 level and below while the resistance is located above the moving averages at the $54,000 and above. Technically, Bitcoin is currently moving into the negative side as the technical indicator RSI (14) moves into the oversold region.


