

Bitcoin Price Prediction: BTC/USD Breakdown Below $45,000 Looms
Bitcoin Price Prediction – December 31
The Bitcoin price prediction is struggling to recover above $47,000 as the coin remains at a risk of a larger breakdown below the $45,000 support.
BTC/USD Long-term Trend: Bearish (Daily Chart)
Key levels:
Resistance Levels: $52,000, $50,000, $48,000
Support Levels: $42,000, $40,000, $38,000
BTCUSD – Daily Chart
BTC/USD has been struggling to maintain its position above $47,000 but its price sees another dive below the $48,574 mark today. This battle comes after the coin tried and failed to extend gains above the 9-day and 21-day moving averages. The Bitcoin price is back under $47,000 and currently changing hands at $46,984. Meanwhile, the Bitcoin price failed to cross above the 9-day and the 21-day moving averages within the descending channel.
Bitcoin Price Prediction: Where is BTC Price Going Next?
An upside break above the moving averages is a must to start a substantial recovery. However, the next hurdles for the Bitcoin price may be seen above the upper boundary of the channel on its way to the resistance levels of $52,000, $54,000, and $56,000. On the downside, the initial support is below the support level of $45,000 and if there is a successful break below this level, the bears are likely to gain strength by bringing the price to a low of $42,000, $40,000, and $38,000 respectively.
Currently, the Bitcoin price follows a dominant bearish bias and a glance at the technical indicator Relative Strength Index (14) reveals that the market may experience more downtrend if the signal line crosses below 40-level.
BTC/USD Medium – Term Trend: Ranging (4H Chart)
BTC/USD trades within the range of $45,000 to $48,000. Nevertheless, Bitcoin has not yet slipped below $45,000 and is still in the loop of making a bounce back. BTC price hovers around $46,936 and may take time to persistently trade above $48,000. The upward movement could be facing hurdles near the resistance level of $49,500 and above.
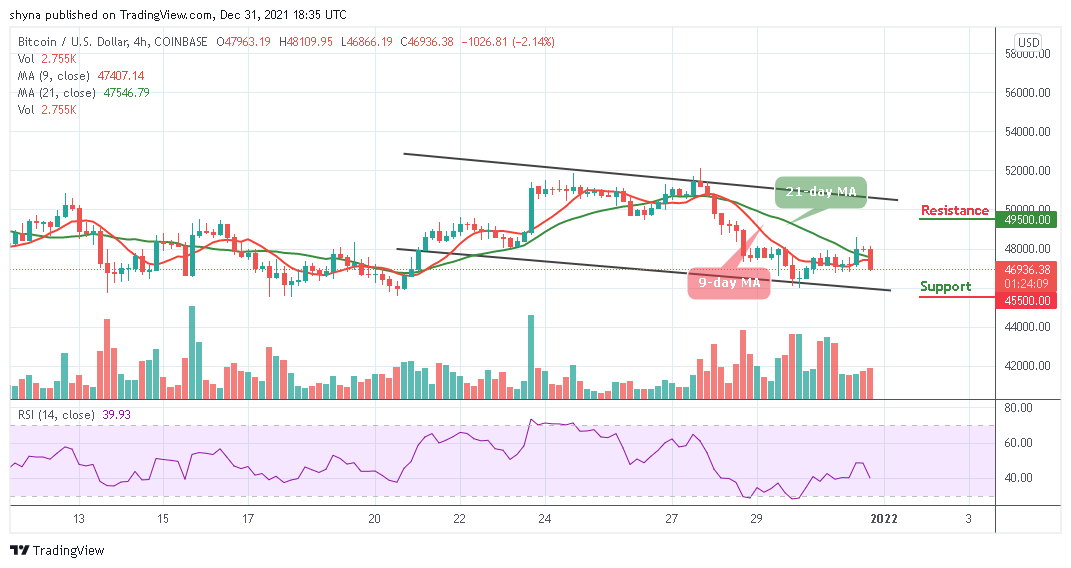
BTCUSD – 4 Hour Chart
However, on the downside, immediate support is near the $46,500 level while the main support below the lower boundary of the channel. The price might slide sharply below $46,000 which may likely test another support at the $45,500 and below. Technically, Bitcoin is poised for more losses in the near-term as the technical indicator Relative Strength Index (14) is likely to cross below 40-level to confirm the bearish movement for the market.
Looking to buy or trade Bitcoin (BTC) now? Invest at eToro!
68% of retail investor accounts lose money when trading CFDs with this provider
Read more:


