Bitcoin (BTC/USD) Market Retraces, Finding Support at $60,000
 Market Retraces, Finding Support at ,000")
Bitcoin Price Prediction – October 25
The BTC/USD market retraces, finding support at a $60,000 trading line on about three different days sessions. The crypto’s price trades at a positive percentage rate of 3.72, keeping around a value line of $62,634 as of writing.
BTC/USD Market
Key Levels:
Resistance levels: $65,000, $67,500, $70,000
Support levels: $60,000, $57,500, $55,000
BTC/USD – Daily Chart
The BTC/USD daily chart shows that the crypto market retraces, finding support at $60,000 level while a smaller differential couple of candlesticks with bottom shadows appeared closely over the point. Currently, a bullish candlestick is in the making, signifying that an upward pressure dominates the market axis. The 14-day SMA trend line is above the 50-day SMA trend line as they are both underneath the current trading zone. The Stochastic Oscillators have dipped into the oversold region, trying to cross the lines northbound a bit over the zero range line. That adds to the upward signal that the base trading instrument is waxing stronger against the US Dollar.
When do traders expect a reliable downward motion as the BTC/USD market retraces, finding supports at $60,000?
In the first place, it must be that the law of gravity, most of the time, applies to trading variant instruments pairing with one and another. The BTC/USD market retraces, finding supports at the $60,000 level portends that bulls are getting re-positions to push back northwardly. As a result, buying entries will mostly come up when a lighter active motion to the downside coupling with more active rebounding moving efforts.
On the downsized, from the closer technical viewing point, the market level at $60,000 needed to breach southward sustainably to ensure a safe re-appearance of the BTC/USD market bears. On the contrary, the crypto trade may gradually continue to push to the north side in a bid to face a higher resistance trading level on a long-term basis. As that can be the afterward outcome, traders will have to be wary of their entries.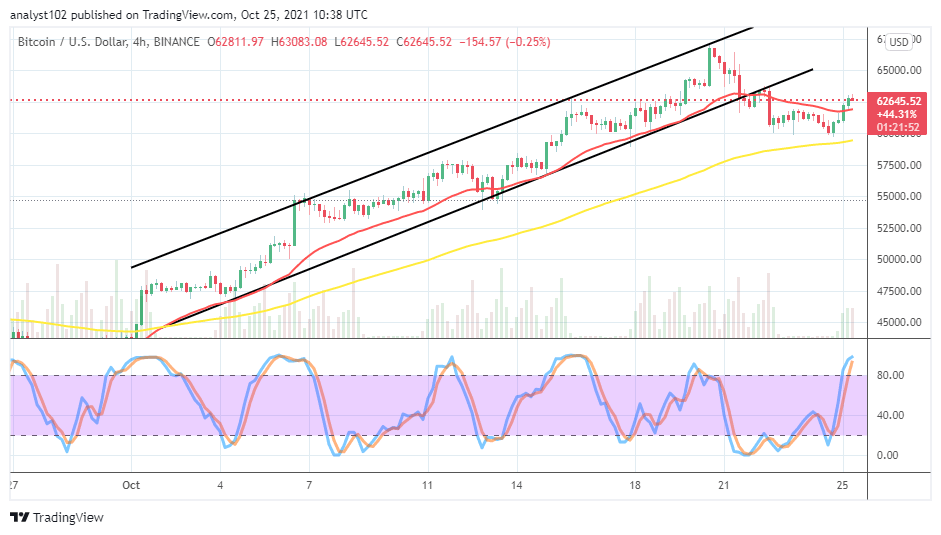
BTC/USD 4-hour Chart
The BTC/USD medium-term chart depicted that the crypto market retraces, finding support around $60,000. The market now strives to rebound, trading around $62,500. The 14-day SMA trend line is located closely beneath the value line as the 50-day SMA trend line is closer beneath the value line earlier mentioned. The Stochastic oscillators are in the overbought region, attempting to close the lines. That could mean that the market may experience a pit stop around its current trading zone for a while.
Looking to buy or trade Bitcoin (BTC) now? Invest at eToro!
68% of retail investor accounts lose money when trading CFDs with this provider.
Read more: