

Bitcoin (BTC) Price Prediction: BTC/USD Reaches a Striking Distance Above $58,000 Overhead Resistance, Targets the $61,000 High
 Price Prediction: BTC/USD Reaches a Striking Distance Above ,000 Overhead Resistance, Targets the ,000 High")
Bitcoin (BTC) Price Prediction – March 11, 2021
BTC/USD has continued its gradual push on the upside as it came close to the $58,000 overhead resistance. Yesterday, buyers pushed BTC price above $57,000 high but the price pulled back below it. The king coin is fluctuating as it is finding penetration difficult at the recent high.
Resistance Levels: $58,000, $59,000, $60,000
Support Levels: $40,000, $39,000, $38,000
Following the breakout above the $57,000 resistance, and the subsequent pullback, the bulls are still struggling to break above the recent high. Yesterday, the BTC price slumped to $54,500 after the bulls turned down from the resistance zone. Today, buyers have pushed BTC to the resistance zone but the price is consolidating below it. This is a positive move as price is consolidating below the resistance zone. Consolidation near the resistance level increases the chances of a breakout on the upside.
For instance, a breakout at the $57,000 and $58,000 resistance will propel price to rally to $61,000 high. Conversely, if the bulls turn down from the overhead resistance, the bears will want to plunge the coin to the $52,000 low. Historically, the month of March has been the worst Bitcoin price correction which is called the Bitcoin “Black Thursday” on March 12. On that day Bitcoin crashed to as low as $3,800. Traders and investors were gripped with fear as there was panic selling and stop losses were being hit. This “Black Thursday” happened after the $10,000 resistance was retested. The crypto dropped more than 50% but it rebounded later.
Bitcoin (BTC) Indicator Reading
Bitcoin is above the 80% range of the daily stochastic. BTC price has been sloping above the overbought region since March 7. The 21-day and 50-day SMAs are sloping northward indicating the uptrend. BTC price is also at level 73 of the Relative Strength Index period 14. It indicates that the coin has not gotten enough room to rally on the upside.
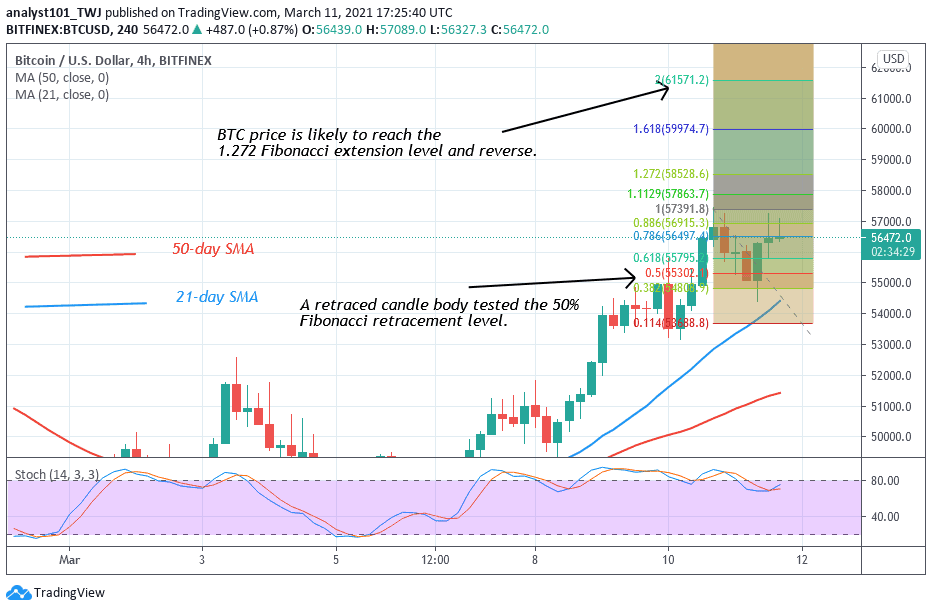
Bitcoin bulls are attempting to break the recent high. The Fibonacci tool has indicated a further upward movement of the coin. On March 10 uptrend; a retraced candle body tested the 50% Fibonacci retracement level. The retracement indicates that Bitcoin will rise to level 2.0 Fibonacci extensions or the high of $61,571.20. Presently, the market has risen to $57,289 at the time of writing.


